asciiread
- mipylib.dataset.midata.asciiread(filename, **kwargs)
Read data from an ASCII file.
- Parameters:
filename – (string) The ASCII file name.
delimiter – (string) Field delimiter character. Default is
None, means space or tab delimiter.headerlines – (int) Lines to skip at beginning of the file. Default is
0.shape – (string) Data array dimension shape. Default is
None, the file content will be readed as one dimension array.readfirstcol – (boolean) Read first column data or not. Default is
True.
- Returns:
(MIArray) The data array.
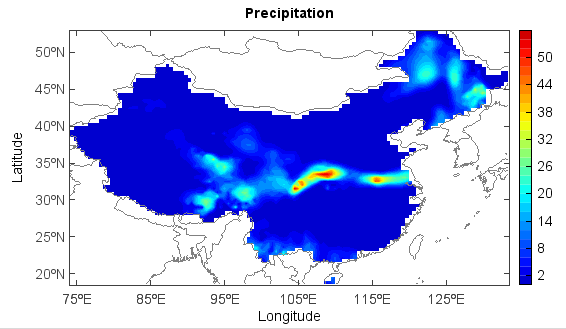
Read grid data from ASCII file:
rain = asciiread('D:/Temp/ascii/SURF_CLI_CHN_PRE_DAY_GRID_0.5-20120702.txt',headerlines=6,shape=(72,128))
rain1 = rain[::-1,:]
x = arange1(72, 128, 0.5)
y = arange1(18, 72, 0.5)
axesm()
mlayer = shaperead('D:/Temp/map/country1.shp')
geoshow(mlayer)
layer = contourfm(x, y, rain1, 20)
title('Precipitation')
ylabel('Latitude')
xlabel('Longitude')
colorbar(layer)
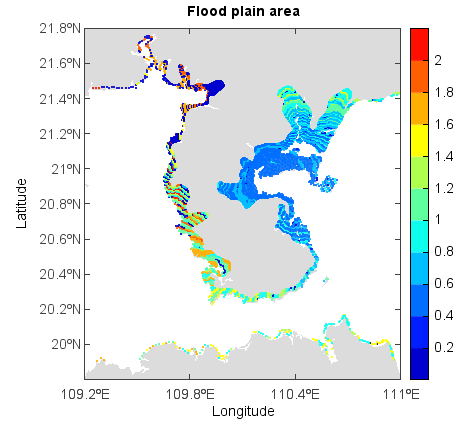
Read station data from ASCII file.
numasciicol()andnumasciirow()functions were used to get column and row number of the file:fn = 'D:/Temp/ascii/flood.dat' ncol = numasciicol(fn) nrow = numasciirow(fn) a = asciiread(fn,shape=(nrow,ncol)) lon = a[:,0] lat = a[:,1] v = a[:,2] axesm() mlayer = shaperead('D:/Temp/map/bou2_4p.shp') geoshow(mlayer, facecolor=(220,220,220), edgecolor=None) layer = scatterm(lon, lat, v, edge=False, size=2) xlim(109.2, 111) ylim(19.8, 21.8) title('Flood plain area') ylabel('Latitude') xlabel('Longitude') colorbar(layer)