linint2
- mipylib.numeric.minum.linint2(*args, **kwargs)
Interpolates from a rectilinear grid to another rectilinear grid using bilinear interpolation.
- Parameters
x – (array_like) X coordinate array of the sample data (one dimension).
y – (array_like) Y coordinate array of the sample data (one dimension).
z – (array_like) Value array of the sample data (muti-dimension, last two dimensions are y and x).
xq – (array_like) X coordinate array of the query data (one dimension).
yq – (array_like) Y coordinate array of the query data (one dimension).
- Returns
(array_like) Interpolated array.
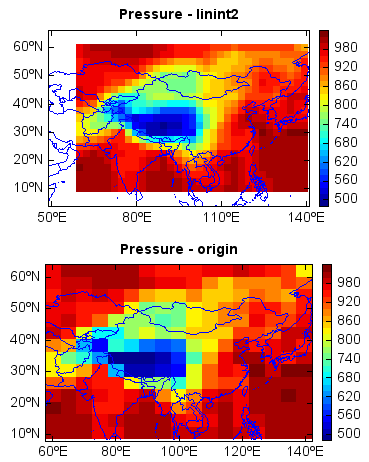
Examples
f = addfile('D:/Temp/GrADS/model.ctl')
ps = f['PS'][:,'10:60','60:140']
lon = arange(50, 142, 2.5)
lat = arange(5, 66, 2.5)
nps = linint2(ps, lon, lat)

levs = arange(500, 1021, 20)

#Plot
subplot(2,1,1)
axesm(newaxes=False)
geoshow('country', edgecolor=(0,0,255))
layer = imshowm(lon, lat, nps[1,:,:], levs)
title('Pressure - linint2')
colorbar(layer)

subplot(2,1,2)
axesm(newaxes=False)
geoshow('country', edgecolor=(0,0,255))
layer = imshowm(ps[1,:,:], levs)
title('Pressure - origin')
colorbar(layer)