beta
- numeric.stats.beta
A beta continuous random variable.
The probability density function for beta is:
\[f(x, a, b) = \frac{\gamma(a+b) x^{a-1} (1-x)^{b-1}} {\gamma(a) \gamma(b)}\]for \(0 < x < 1\), \(a > 0\), \(b > 0\), where \(\gamma(z)\) is the gamma function.
beta takes \(a\) and \(b\) as shape parameters.
Examples:
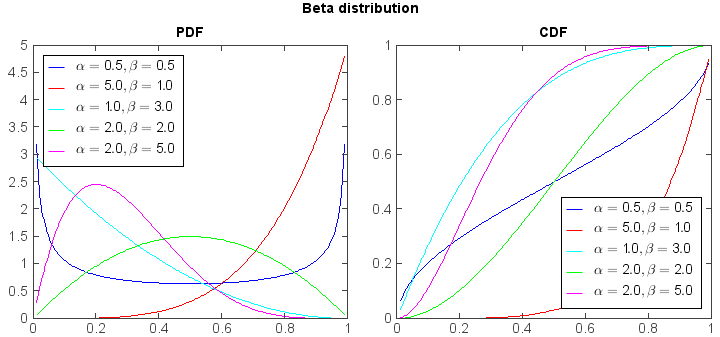
from mipylib.numeric import stats

x = arange(0.01, 1, 0.01)
aa = [0.5, 5, 1, 2,2]
bb = [0.5, 1, 3, 2 ,5]
ss = ['-b', '-r', '-c', '-g', '-m']

#PDF
subplot(1,2,1)
for a,b,s in zip(aa,bb,ss):
    y = stats.beta.pdf(x, a, b)
    plot(x, y, s, label=r'$\alpha = %.1f, \beta = %.1f$' % (a, b))
legend(loc='upper left', facecolor='w')
ylim(0, 5)
xlim(0, 1)
title('PDF')

#CDF
subplot(1,2,2)
for a,b,s in zip(aa,bb,ss):
    y = stats.beta.cdf(x, a, b)
    plot(x, y, s, label=r'$\alpha = %.1f, \beta = %.1f$' % (a, b))
legend(loc='lower right', facecolor='w')
ylim(0, 1)
xlim(0, 1)
title('CDF')

suptitle('Beta distribution')