annotate
- mipylib.plotlib.miplot.annotate(s, xy, *args, **kwargs)
Add an axes to the figure.
Annotate the point xy with text s.
- Parameters:
s – (string) The text of the annotation.
xy – (float, float) The point (x,y) to annotate.
xytext – (float, float) The position (x,y) to place the text at. If None, defaults to xy.
- Returns:
Annotation.
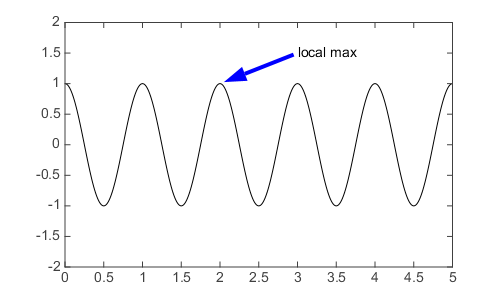
Example:
x = arange(0.0, 5.0, 0.01)
y = cos(2 * pi * x)
plot(x, y, lw = 2)
annotate('local max', (2,1), (3,1.5), yalign='center',
    arrowprops=dict(linewidth=4, headwidth=15, color='b', shrink=0.05))
ylim(-2, 2)