colorbar
- mipylib.plotlib.miplot.colorbar(layer, **kwargs)
Add a colorbar to a plot.
- Parameters:
layer – (MapLayer) The layer in plot.
cmap – (string) Color map name. Default is None.
shrink – (float) Fraction by which to shrink the colorbar. Default is 1.0.
orientation – (string) Colorbar orientation:
verticalorhorizontal.aspect – (int) Ratio of long to short dimensions.
fontname – (string) Font name. Default is
Arial.fontsize – (int) Font size. Default is
14.bold – (boolean) Is bold font or not. Default is
False.extendrect – (boolean) If
Truethe minimum and maximum colorbar extensions will be rectangular (the default). IfFalsethe extensions will be triangular.extendfrac – [None | ‘auto’ | length] If set to None, both the minimum and maximum triangular colorbar extensions with have a length of 5% of the interior colorbar length (the default). If set to ‘auto’, makes the triangular colorbar extensions the same lengths as the interior boxes . If a scalar, indicates the length of both the minimum and maximum triangle colorbar extensions as a fraction of the interior colorbar length.
ticks – [None | list of ticks] If None, ticks are determined automatically from the input.
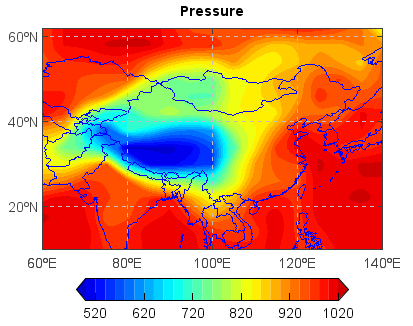
Example:
f = addfile('D:/Temp/GrADS/model.ctl')
psv = f['PS']
ps = psv[0,[10,60],[60,140]]
axesm()
mlayer = shaperead('D:/Temp/map/country1.shp')
geoshow(mlayer, edgecolor=(0,0,255))
#layer = contourm(ps, 20)
layer = contourfm(ps, 20)
title('Pressure')
yticks(arange(20, 61, 20))
grid()
colorbar(layer, orientation='horizontal', extendrect=False, shrink=0.8, aspect=12)