fill_between
- mipylib.plotlib.miplot.fill_between(x, y1, y2=0, where=None, **kwargs)
Make filled polygons between two curves (y1 and y2) where
where==True.- Parameters:
x – (array_like) An N-length array of the x data.
y1 – (array_like) An N-length array (or scalar) of the y data.
y2 – (array_like) An N-length array (or scalar) of the y data.
where – (array_like) If None, default to fill between everywhere. If not None, it is an N-length boolean array and the fill will only happen over the regions where
where==True.
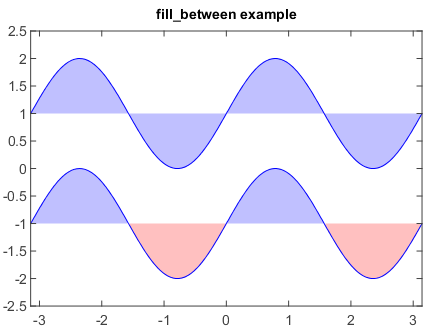
Examples
n = 256
X = linspace(-pi,pi,n,endpoint=True)
Y = sin(2*X)

fill_between(X, 1, Y+1, color='blue', alpha=.25)
plot(X, Y+1, color='blue')

fill_between(X, -1, Y-1, (Y-1) > -1, color='blue', alpha=.25)
fill_between(X, -1, Y-1, (Y-1) < -1, color='red',  alpha=.25)
plot(X, Y-1, color='blue')
xlim(-pi, pi)
ylim(-2.5, 2.5)
title('fill_between example')