geoshow
- mipylib.plotlib.miplot.geoshow(*args, **kwargs)
Display map layer or longitude latitude data.
geoshow(shapefilename) - Displays the map data from a shape file. geoshow(layer) - Displays the map data from a map layer which may created by
shapereadfunction. geoshow(S) - Displays the vector geographic features stored in S as points, multipoints, lines, or polygons. geoshow(lat, lon) - Displays the latitude and longitude vectors.Example:
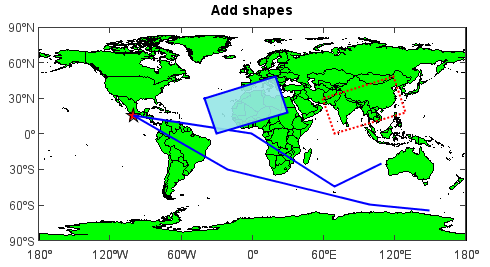
axesm(tickfontsize=12)
geoshow('country', edgecolor='k', facecolor='g')
#Add point
geoshow(15, -100, size=14, color='r', marker='S')
#Add line
lat = [15, 0, -45, -25, nan, 15, -30, -60, -65]
lon = [-100, 0, 70, 110, nan, -100, -20, 100, 150]
geoshow(lat, lon, size=2, color='b')
#Add line and polygon
lat = array([30, 0, 18, 48, 30])
lon = array([60, 70, 130, 120, 60])
geoshow(lat, lon, color='r', size=2, linestyle=':')
lon = lon - 100
geoshow(lat, lon, displaytype='polygon', color=[150,230,230,230], edgecolor='b', size=2)
#Set extent
xlim(-180, 180)
ylim(-90, 90)
xticks(arange(-180, 181, 30))
yticks(arange(-90, 91, 30))
title('Add shapes')