xticks
- mipylib.plotlib.miplot.xticks(locs, labels, rotation=0)
Set the x-limits of the current tick locations and labels.
- Parameters:
locs – (array_like) Tick locations.
labels – (string list) Tick labels.
fontname – (string) Font name. Default is
Arial.fontsize – (int) Font size. Default is
14.bold – (boolean) Is bold font or not. Default is
True.color – (color) Tick label string color. Default is
black.rotation – (float) Tick label rotation angle. Default is 0.
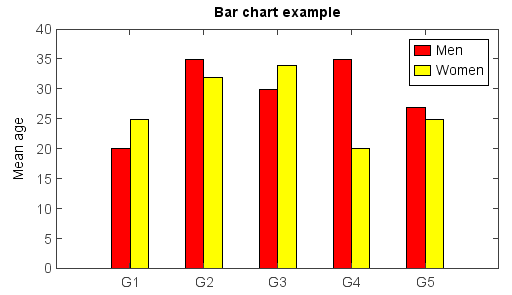
Example:
menMeans = [20, 35, 30, 35, 27]
bar(menMeans, color='r', label='Men')
womenMeans = [25, 32, 34, 20, 25]
bar(womenMeans, color='y', label='Women')
ylim(0, 40)
ylabel('Mean age')
xticks(arange(1, len(menMeans) + 1), ['G1','G2','G3','G4','G5'])
legend()
title('Bar chart example')