MeteoInfoLab GUI
When you start MeteoInfoLab, the desktop appears in its default layout.
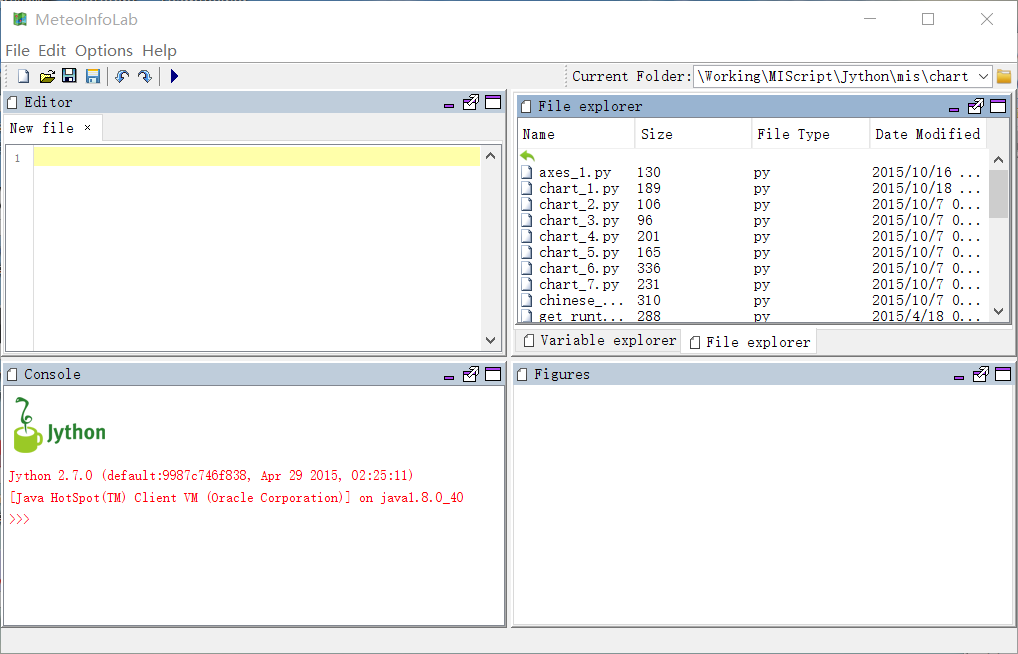
The desktop includes these panels:
Current Folder (File explorer) -> Acess your files.
Console -> Enter commands at the command line, indicated by the prompt (>>>).
Editor -> Script program editor.
Variable explorer -> Explore created variables.
Figures -> Display created figures
As you work in MeteoInfoLab, you issue commands that create variables and call funcitons. For
example, create two variables named a and b by typing this statement at the command line:
>>> a = 1
>>> b = 2
Then create c variable by adding a and b. The variable value can be printed by typing
variable name:
>>> c = a + b
>>> c
3
And try other functions:
>>> d = cos(a)
>>> d
0.5403023058681398
>>> e = a * b
>>> e
2
You can recall previous commands by pressing the up- and down-arrow key.
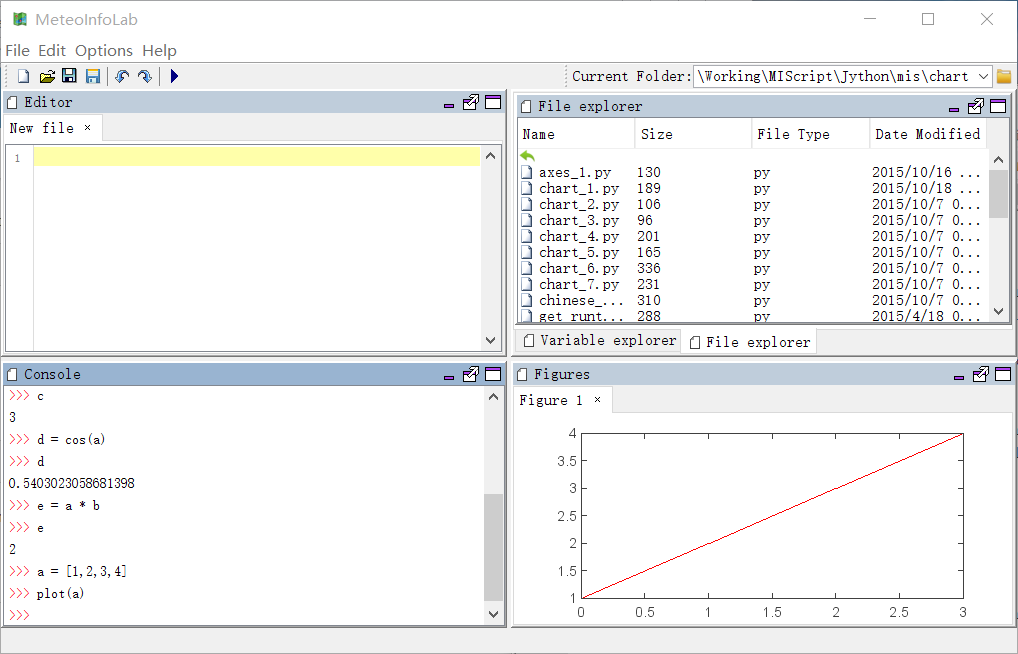
You can create and show a figure in figures panel by using plot related commands:
>>> a = [1,2,3,4]
>>> plot(a)
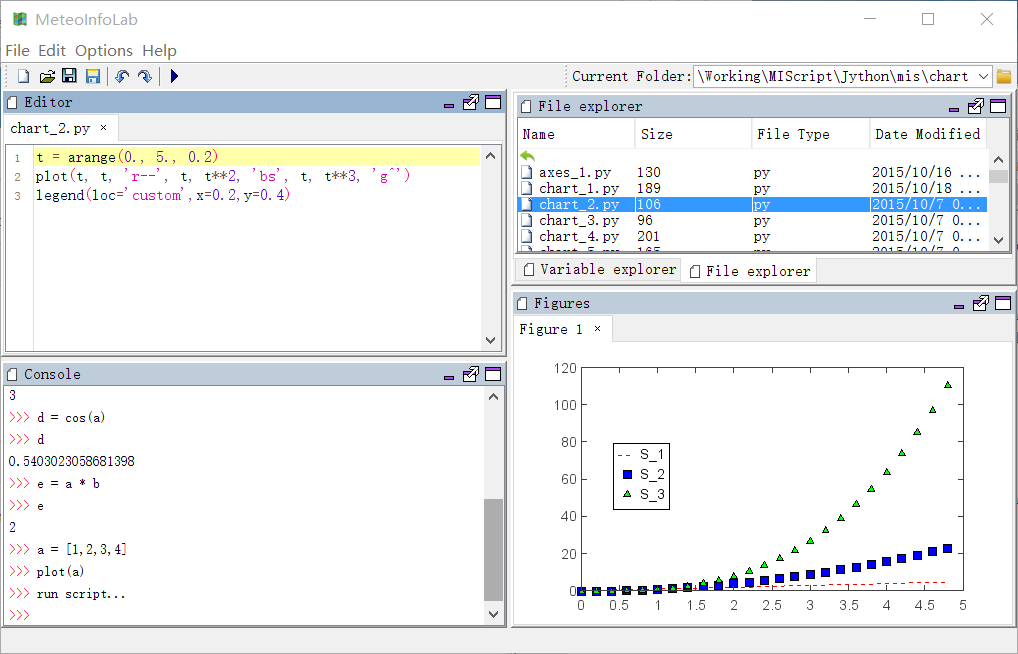
Also you can write a script program in editor panel and run it by clicking Run Script button
in toolbar.