Automatic outlier flag
A flag setting object should be created using flagset() function. Then the outliers of data array
can be automaticly flagged by check_all() function. Following steps were demonstrated in below
smaple script.
Read data table from example data file using
readtable()function.Read time and PM2.5 data array from the table by data column name.
Create a flag setting object using
flagset()function with expected arguments.Make flag codes using
check_all()function from PM2.5 data array and the flag setting.Make colors from flag codes by
makecolors()function, and plot data with the colors (flagged data were highlighted with blue color).Add flag codes to the table and save the result into a new data file.
#Read data
fn = r'D:\MyProgram\Distribution\Java\MeteoInfo\MeteoInfo_Run\toolbox\OutlierFlag\sample\54826PMMUL201102_T.txt'
table = readtable(fn, delimiter=',', format='%{yyyyMMddHHmm}D%14i%11f%i%f%i%4f%i%3f')
pm2_5 = table['PM2.5']
tt = table['BeiJing_Time']
#Set flagset and check - get flag codes
fset = qaqc.flagset(minlim=-10, maxlim=50000, errornum=11, quantilenum=21, quantil=0.9, factor=2.3, stdnum=29, stdfactor=3)
fcodes = qaqc.check_all(pm2_5, fset)
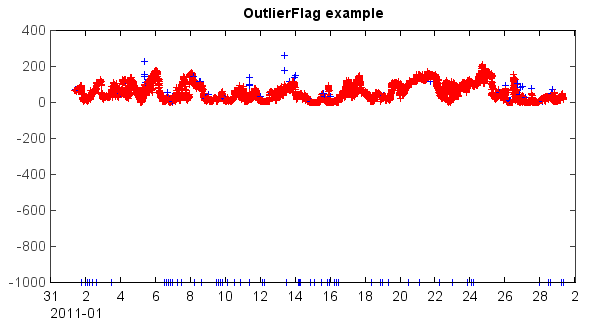
#Plot data - highlight flagged data with blue color
cols = qaqc.makecolors(fcodes, c=['r','g','b'])
scatter(tt, pm2_5, s=6, edge=False, c=cols, marker='+')
xaxis(axistype='time')
title('OutlierFlag example')
#Add flag codes to table and save
table.addcoldata('Flag_PM2.5', 'string', fcodes)
outfn = 'D:/Temp/flag_test.csv'
table.savefile(outfn)
The scatter plot of the PM2.5 data array with blue color highlighted flagged data points.