MeteoInfo 1.3.4 was released (2016-7-12)
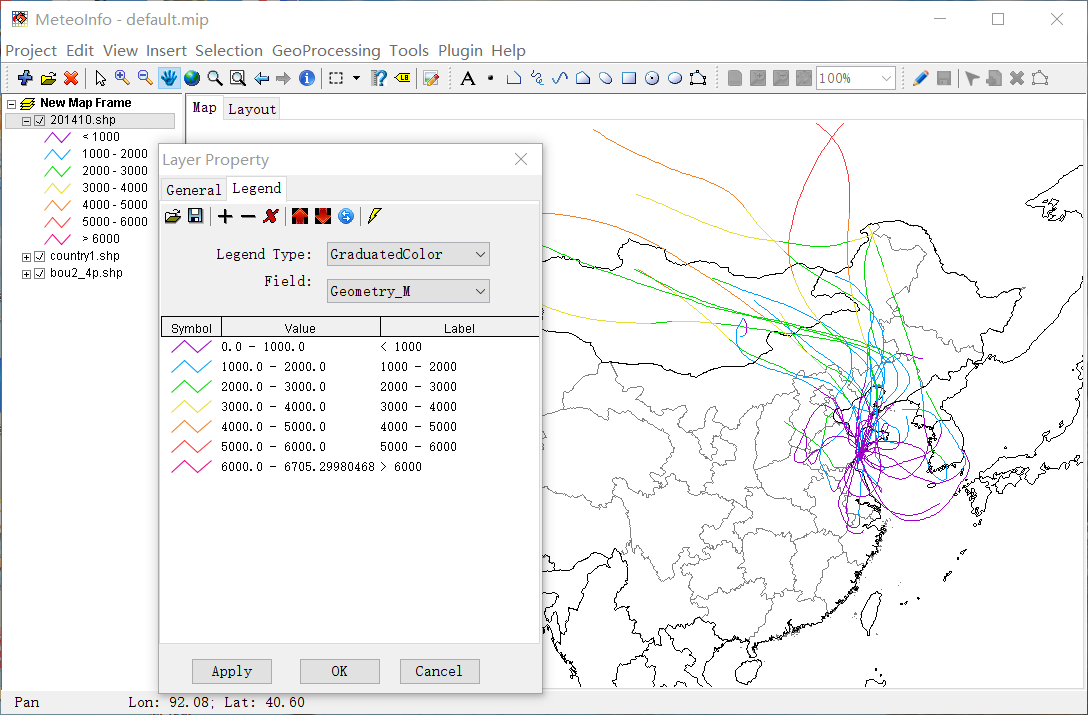
MeteoInfo 1.3.4 was released. Vector layer with PolylineZ shapes can be plotted as multi-color lines according M or Z values of each point of line.
Here is an example to plot back-trajectory line layer. Each trajectory is a PolylineZ shape contains some PointZ points which have M and Z values beside X and Y values. For the trajectory layer created from HYSPLIT trajectory endpoints file, M is height of each endpoint and Z is pressure value. Double click the layer and open “Layer Property” dialog. Switch to “Legend” tab and select “Legend Type” to “GraduatedColor”, then select “Field” as “Geometry_M” (height) or “Geometry_Z” (pressure). Press “Apply” or “OK” button then trajectory lines will be plotted as multi-color lines.