MeteoInfo 1.4.4 was released (2017-5-26)
imagelib package was added in mipylib and some image processing functions were provided.
Image flip:
fn = 'D:/Temp/image/Lenna.png'
lena = imagelib.imread(fn)
subplot(1, 2, 1,aspect='equal', tickline=False)
imshow(lena)
subplot(1, 2, 2, aspect='equal', tickline=False)
lena_1 = imagelib.flip(lena)
imshow(lena_1)
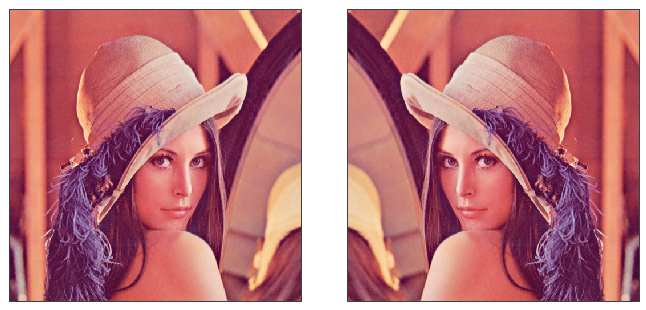
Image gray scale:
fn = 'D:/Temp/image/Lenna.png'
lena = imagelib.imread(fn)
subplot(1, 2, 1,aspect='equal', tickline=False)
imshow(lena)
subplot(1, 2, 2, aspect='equal', tickline=False)
lena_1 = imagelib.gray_scale(lena)
imshow(lena_1)
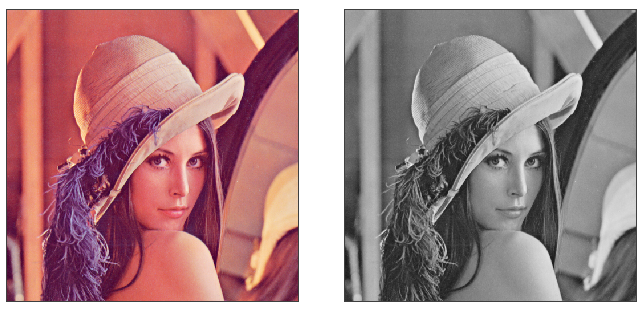
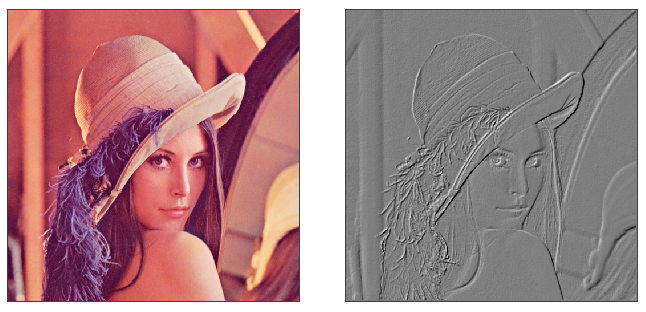
Image emboss:
fn = 'D:/Temp/image/Lenna.png'
lena = imagelib.imread(fn)
subplot(1, 2, 1,aspect='equal', tickline=False)
imshow(lena)
subplot(1, 2, 2, aspect='equal', tickline=False)
lena_1 = imagelib.emboss(lena)
imshow(lena_1)
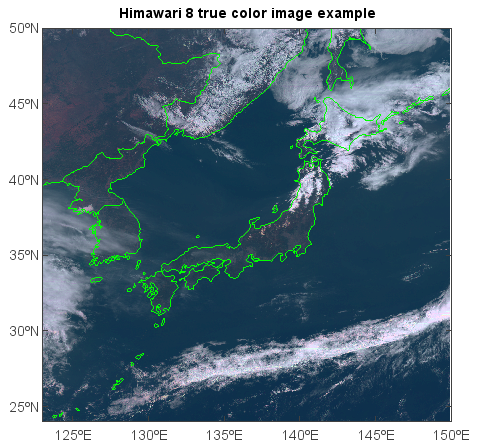
Create Himawari 8 satellite true color image:
#Add data file
fn = r'C:\Temp\himawari8\NC_H08_20170508_0040_r14_FLDK.02701_02601.nc'
f = addfile(fn)
#Read data
bdata = f['albedo_01'][:,:]
gdata = f['albedo_02'][:,:]
rdata = f['albedo_03'][:,:]
bdata[bdata>1] = 1
gdata[gdata>1] = 1
rdata[rdata>1] = 1
#Plot
axesm()
mlayer = shaperead('D:/Temp/map/country1.shp')
geoshow(mlayer, edgecolor='g')
layer = imshowm([rdata,gdata,bdata])
#Adjust image
imagelib.hsb_adjust(layer, h=0, s=0.1, b=0.2)
title('Himarari 8 true color image example')