MeteoInfo 4.1 was released (2025-8-18)
Add cape_cin, dry_lapse, moist_lapse and many other functions in meteolib package
Add solve_ivp function in numeric package as ODE solver
Add lambertw function in numeric package
Add shapewrite in geolib package for writing shape file
Add topelitz function in numeric package for create Topeliz matrix
Add count_nonzero function in numeric package
Support epsg projection code
Update surf function with texturemap alpha support
Update commons-imaging to version 1.0.0-alpha6
Update netCDF to version 3.9.0
Some bug fixed
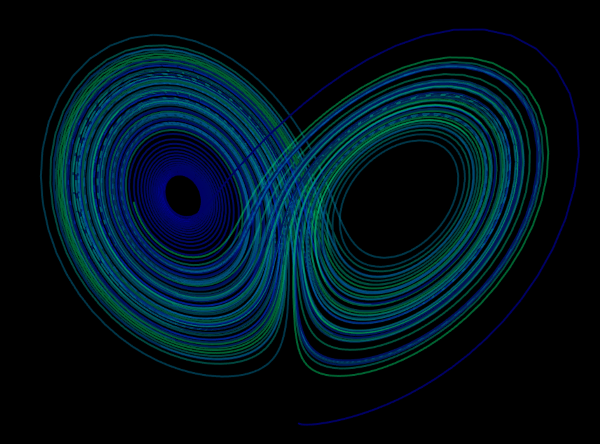
solve_ivp example for Lorenz attractor
from mipylib.numeric.integrate import solve_ivp

# Create an image of the Lorenz attractor.

# Lorenz paramters and initial conditions.
sigma, beta, rho = 10, 2.667, 28
u0, v0, w0 = 0, 1, 1.05

# Maximum time point and total number of time points.
tmax, n = 100, 10000

def lorenz(t, X, sigma, beta, rho):
    """The Lorenz equations."""
    u, v, w = X
    up = -sigma*(u - v)
    vp = rho*u - v - u*w
    wp = -beta*w + u*v
    return up, vp, wp

# Integrate the Lorenz equations.
soln = solve_ivp(lorenz, (0, tmax), (u0, v0, w0), args=(sigma, beta, rho),
                 dense_output=True)
# Interpolate solution onto the time grid, t.
t = np.linspace(0, tmax, n)
x, y, z = soln.sol(t)

ax = axes3d(facecolor='k', aspect='equal', clip_plane=False)

# Make the line multi-coloured by plotting it in segments of length s which
# change in colour across the whole time series.
s = 10
colors = plt.makecolors(255, cmap='MPL_winter')
for i in range(0,n-s,s):
    ax.plot(x[i:i+s+1], y[i:i+s+1], z[i:i+s+1], color=colors[i*255/n],
        linewidth=3, alpha=0.4)

# Remove all the axis clutter, leaving just the curve.
ax.set_axis_off()