OutlierFlag
Introduction:
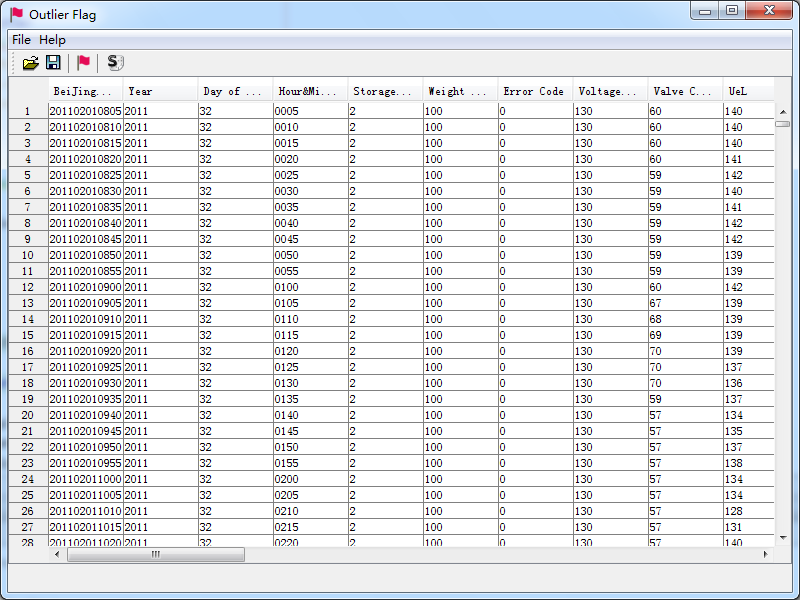
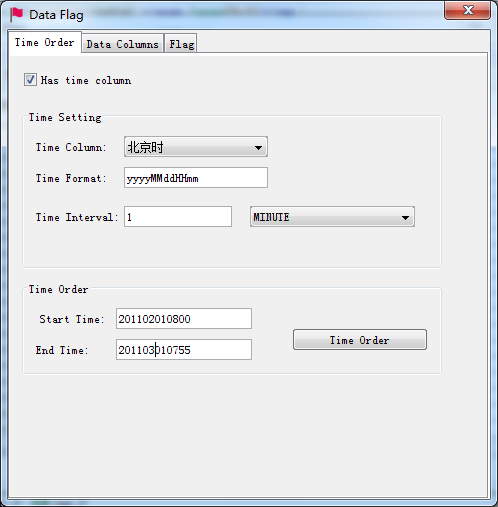
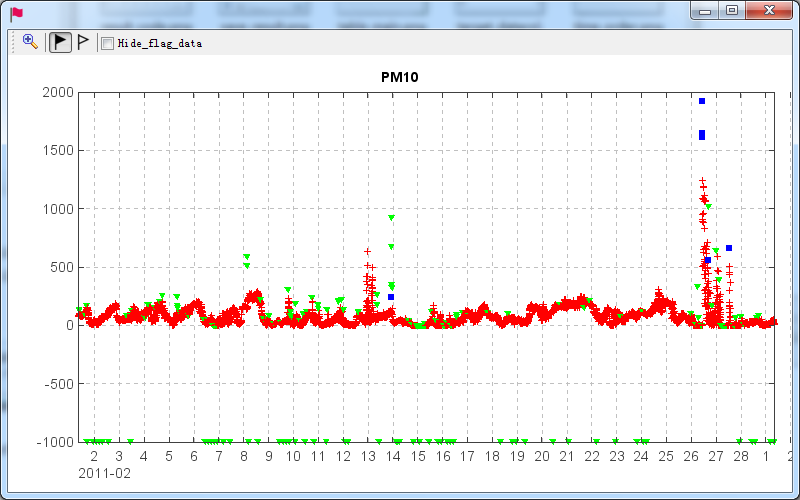
Scientific dataset observed by instruments usually includes some outlier values which have to be flagged in data quality control process. OutlierFlag was developed to make it accurate and easy by providing a suitable outlier data flagging algorithm and a friendly GUI. There are three steps of limitation, error and standard deviation checking one by one in the algorithm and several parameters are configurable so the algorithm can be used for various datasets.
OutlierFlag is open source software written in Java and the MeteoInfo library was used for data plotting function. OutlierFlag can be run as a standalone desktop program or as a toolbox application in MeteoInfoLab.
The developed outlier data flagging algorithm includes the following three steps:
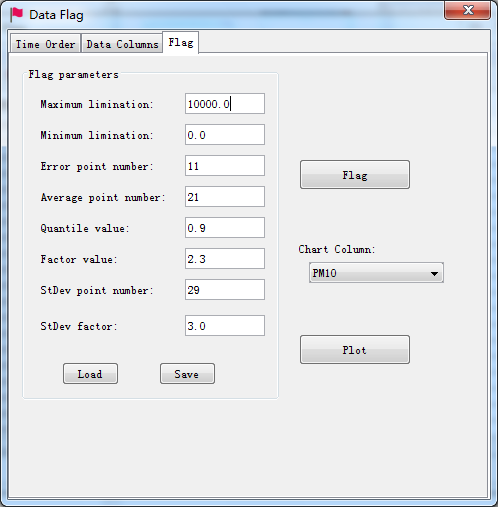
(1) Limitation Check: The data points will be determined as outliers if their values are out of the range between minimum and maximum limitation values. The limitation values are assigned according the features of the observational data series and the environment of observation station. Reasonable limitation values are the key to ensure the accuracy of detection results.
(2) Error Check: It is generally agreed that surrounding points are related to each other and the distribution of them have a certain variation and characteristics during a continuous time segment, so the sudden change of the data value or the difference between two data points are likely to represent the appearance of an error point. In this step, firstly calculate an error list of all data points with an assigned surrounding point number (default value is 11), the error of each data point is the subtract of its value and the mean value of the all surrounding points. Then get a sub error list for each data point using another surrounding point number (default value is 21), and calculate the quantile value of the list with an assigned quantile (default value is 0.9). The data point is determined as an outlier if its error is bigger than the product of the quantile value and the given zoom factor (default value is 2.3).
(3) Standard Deviation Check: This step is according to the standard deviation threshold to do a further detection after Error check. Firstly, construct a data list by the values of a certain data point and its surrounding data points with the default data point number of 29. Then calculate the error of the data point by subtracting its value to the mean value of the data list. Also the standard deviation of the data list is calculated. The data point is determined as an outlier if its error is bigger than 3 or other user defined times of the standard deviation.
Authors:
Yaqiang Wang, yaqiang.wang@gmail.com
Shuai Huang
Peng Zhao,
Johannes Lüers
Publication:
Huang, S., Wang, Y., Xie, Y., Zhao, P. and Lüers, J., 2016. OutlierFlag: A Tool for Scientific Data Quality Control by Outlier Data Flagging. Journal of Open Research Software, 4: e20, DOI: http://dx.doi.org/10.5334/jors.90.
Source code:
License:
Copyright (C) 2015 Yaqiang Wang, Shuai Huang, Peng Zhao, Johannes Lüers
All rights reserved. Use is subject to license terms.
This library is free software; you can redistribute it and/or modify it under the terms of the GNU Lesser General Public License as published by the Free Software Foundation; either version 3 of the License, or (at your option) any later version.
This library is distributed in the hope that it will be useful, but WITHOUT ANY WARRANTY; without even the implied warranty of MERCHANTABILITY or FITNESS FOR A PARTICULAR PURPOSE. See the GNU Lesser General Public License for more details.
You should have received a copy of the GNU Lesser General Public License along with this library; if not, write to the Free Software Foundation, Inc., 59 Temple Place, Suite 330, Boston, MA 02111-1307, USA.
Distributed under the GNU Lesser General Public License.