streamslice
- Axes3DGL.streamslice(*args, **kwargs):
Plot stream lines slice in 3D axes.
- Parameters:
x – (array_like) X coordinate array.
y – (array_like) Y coordinate array.
z – (array_like) Z coordinate array.
u – (array_like) U component of the arrow vectors (wind field).
v – (array_like) V component of the arrow vectors (wind field).
w – (array_like) W component of the arrow vectors (wind field).
xslice – (list) X slice locations.
yslice – (list) Y slice locations.
zslice – (list) Z slice locations.
density – (int) Streamline density. Default is 4.
- Returns:
Streamline slices
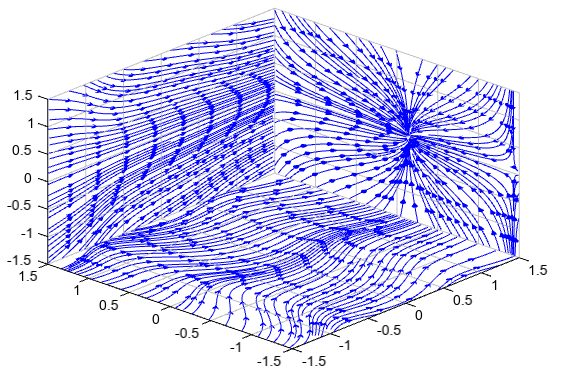
Example of 3D streamline slice plot
# Make the grid
x, y, z = meshgrid(arange(-1.5, 1.6, 0.1),
                   arange(-1.5, 1.6, 0.1),
                   arange(-1.5, 1.6, 0.1))

# Make the direction data for the arrows
u = x + cos(4*x) + 3         # x-component of vector field
v = sin(4*x) - sin(2*y)      # y-component of vector field
w = -z                       # z-component of vector field
speed = sqrt(u*u + v*v + w*w)

streamslice(x, y, z, u, v, w, xslice=1.5, yslice=1.5, zslice=-1.5,
    color='b', linewidth=1, density=4, interval=5)
xlim(-1.5, 1.5)
ylim(-1.5, 1.5)
zlim(-1.5, 1.5)

plt.antialias(True)
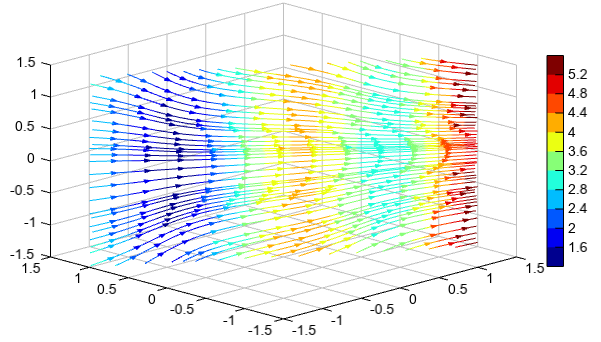
Colorful 3D streamline slice plot
# Make the grid
x, y, z = meshgrid(arange(-1.5, 1.6, 0.1),
                   arange(-1.5, 1.6, 0.1),
                   arange(-1.5, 1.6, 0.1))

# Make the direction data for the arrows
u = x + cos(4*x) + 3         # x-component of vector field
v = sin(4*x) - sin(2*y)      # y-component of vector field
w = -z                       # z-component of vector field
speed = sqrt(u*u + v*v + w*w)

streamslice(x[0,0,:], y[0,:,0], z[:,0,0], u, v, w, speed, interval=10,
    xslice=1.5, yslice=1.5, zslice=-1.5)
colorbar()
xlim(-1.5, 1.5)
ylim(-1.5, 1.5)
zlim(-1.5, 1.5)
antialias()
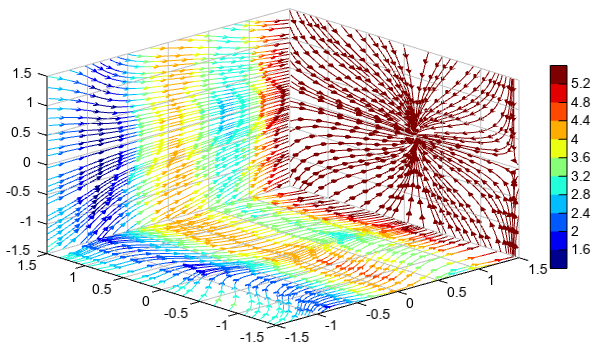
Vertical cross section stream slice with start and end x/y points
# Make the grid
x, y, z = meshgrid(arange(-1.5, 1.6, 0.1),
                   arange(-1.5, 1.6, 0.1),
                   arange(-1.5, 1.6, 0.1))

# Make the direction data for the arrows
u = x + cos(4*x) + 3         # x-component of vector field
v = sin(4*x) - sin(2*y)      # y-component of vector field
w = -z                       # z-component of vector field
speed = sqrt(u*u + v*v + w*w)

streamslice(x[0,0,:], y[0,:,0], z[:,0,0], u, v, w, speed, interval=10,
    xyslice=[-1.5,1,1.5,-1])
colorbar()
xlim(-1.5, 1.5)
ylim(-1.5, 1.5)
zlim(-1.5, 1.5)
antialias()