arrow
- mipylib.plotlib.miplot.arrow(self, x, y, dx, dy, **kwargs)
Add an arrow to the axes.
- Parameters:
x – (float) X coordinate.
y – (float) Y coordinate.
dx – (float) The length of arrow along x direction.
dy – (float) The length of arrow along y direction.
- Returns:
Arrow graphic.
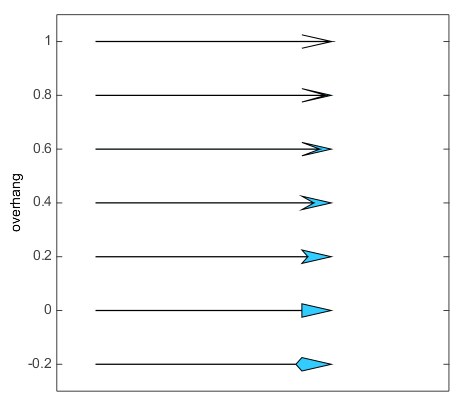
Example:
v = [-0.2, 0, .2, .4, .6, .8, 1]
for i, overhang in enumerate(v):
    arrow(.1,overhang,.6,0, headwidth=0.05, overhang=overhang, length_includes_head=True)

xlim(0, 1)
ylim(-0.3, 1.1)
yticks(v)
xticks([])
ylabel('overhang')
antialias(True)