arrowline
- mipylib.plotlib.miplot.arrowline(x, y, dx=0, dy=0, **kwargs)
Add an arrow line to the axes.
- Parameters:
x – (float or array_like) X coordinates.
y – (float or array_like) Y coordinates.
dx – (float) The length of arrow along x direction. Only valid when x is float.
dy – (float) The length of arrow along y direction. Only valid when y is float.
- Returns:
Arrow line graphic.
Example:
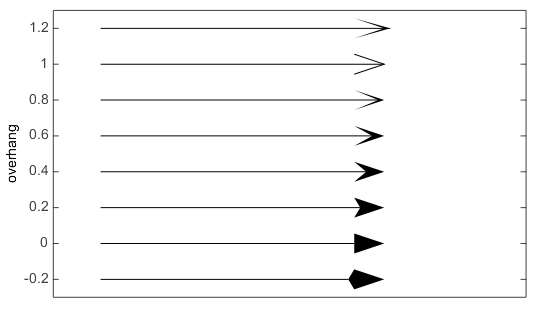
v = [-0.2, 0, .2, .4, .6, .8, 1, 1.2]
for i, overhang in enumerate(v):
    arrowline(.1,overhang,.6,0, headwidth=20,overhang=overhang)

xlim(0, 1)
ylim(-0.3, 1.3)
yticks(v)
xticks([])
ylabel('overhang')
antialias(True)
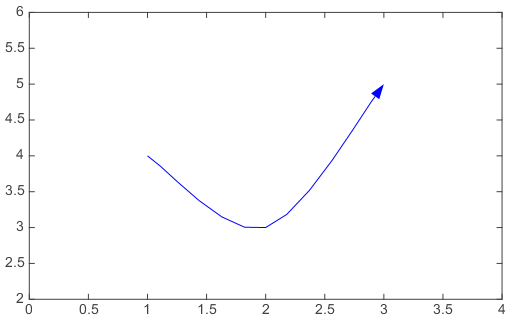
x = [1,2,3]
y = [4,3,5]
arrowline(x, y, color='b', iscurve=True, headwidth=10)
xlim(0, 4)
ylim(2, 6)
antialias(True)