axesm
- mipylib.plotlib.miplot.axesm(**kwarg)
Add an map axes to the figure.
- Parameters:
projinfo – (ProjectionInfo) Optional, map projection, default is longlat projection.
position – (list) Optional, axes position specified by position= [left, bottom, width height] in normalized (0, 1) units. Default is [0.13, 0.11, 0.775, 0.815].
bgcolor – (Color) Optional, axes background color.
bottomaxis – (boolean) Optional, set bottom axis visible or not. Default is
True.leftaxis – (boolean) Optional, set left axis visible or not. Default is
True.topaxis – (boolean) Optional, set top axis visible or not. Default is
True.rightaxis – (boolean) Optional, set right axis visible or not. Default is
True.xyscale – (int) Optional, set scale of x and y axis, default is 1. It is only valid in longlat projection.
gridlabel – (boolean) Optional, set axis tick labels visible or not. Default is
True.gridline – (boolean) Optional, set grid line visible or not. Default is
False.griddx – (float) Optional, set x grid line interval. Default is 10 degree.
griddy – (float) Optional, set y grid line interval. Default is 10 degree.
frameon – (boolean) Optional, set frome visible or not. Default is
True.tickfontname – (string) Optional, set axis tick labels font name. Default is
Arial.tickfontsize – (int) Optional, set axis tick labels font size. Default is 14.
tickbold – (boolean) Optional, set axis tick labels font bold or not. Default is
False.
- Returns:
The map axes.
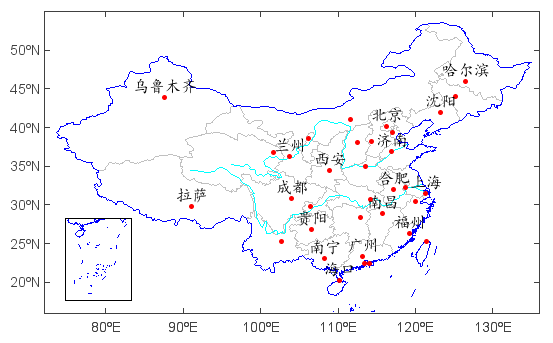
Example:
#Set data folders
basedir = 'D:/MyProgram/Distribution/java/MeteoInfo/MeteoInfo'
mapdir = os.path.join(basedir, 'map')
#Read shape files
bou2_layer = shaperead(os.path.join(mapdir, 'bou2_4p.shp'))
bou1_layer = shaperead(os.path.join(mapdir, 'bou1_4l.shp'))
river_layer = shaperead(os.path.join(mapdir, 'rivers.shp'))
city_layer = shaperead(os.path.join(mapdir, 'res1_4m.shp'))
#Plot
axesm()
geoshow(bou2_layer, edgecolor='lightgray')
geoshow(bou1_layer, facecolor=(0,0,255))
ss = makesymbolspec('line', {'value':'Yangtze', 'color':(0,255,255), 'size':1}, \
    {'value':'Huang He', 'color':(0,255,255), 'size':1}, field='NAME')
geoshow(river_layer, symbolspec=ss)
geoshow(city_layer, facecolor='r', size=4, labelfield='NAME', fontname=u'楷体', fontsize=16, yoffset=15)
xlim(72, 136)
ylim(16, 55)
#Add south China Sea
sc_layer = shaperead(os.path.join(mapdir, 'bou1_4l.shp'))
axesm(position=[0.14,0.18,0.15,0.2], axison=False)
geoshow(sc_layer, facecolor=(0,0,255))
xlim(106, 123)
ylim(2, 23)