axes
- mipylib.plotlib.miplot.axes(**kwarg)
Add an axes to the figure.
- Parameters:
position – (list) Optional, axes position specified by position= [left, bottom, width height] in normalized (0, 1) units. Default is [0.13, 0.11, 0.775, 0.815].
bgcolor – (Color) Optional, axes background color.
bottomaxis – (boolean) Optional, set bottom axis visible or not. Default is
True.leftaxis – (boolean) Optional, set left axis visible or not. Default is
True.topaxis – (boolean) Optional, set top axis visible or not. Default is
True.rightaxis – (boolean) Optional, set right axis visible or not. Default is
True.xaxistype – (string) Optional, set x axis type as ‘normal’, ‘lon’, ‘lat’ or ‘time’.
xreverse – (boolean) Optional, set x axis reverse or not. Default is
False.yreverse – (boolean) Optional, set yaxis reverse or not. Default is
False.
- Returns:
The axes.
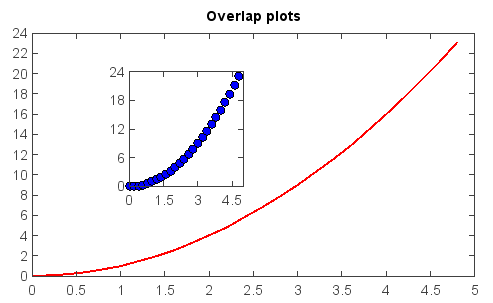
Example:
x = arange(0., 5., 0.2)
y = x**2
plot(x, y, label='Series_1', linewidth=2.0)
title('Overlap plots')
axes(position=[0.3,0.4,0.2,0.4])
plot(x, y, 'bo')