barh
- mipylib.plotlib.miplot.barh(*args, **kwargs)
Make a horizontal bar plot.
- Make a bar plot with rectangles bounded by:
left, left + width, y, y + height
- Parameters:
y – (array_like) The y coordinates of the bars.
width – (array_like) The widths of the bars.
height – (array_like) Optional, the height of the bars default: 0.8.
left – (array_like) Optional, the x coordinates of the bars default: None
color – (Color) Optional, the color of the bar faces.
edgecolor – (Color) Optional, the color of the bar edge. Default is black color. Edge line will not be plotted if
edgecolorisNone.linewidth – (int) Optional, width of bar edge.
label – (string) Label of the bar series.
hatch – (string) Hatch string.
hatchsize – (int) Hatch size. Default is None (8).
bgcolor – (Color) Background color, only valid with hatch.
barswidth – (float) Bars width (0 - 1), only used for automatic bar with plot (only one argument widthout
widthaugument). Defaul is 0.8.morepoints – (boolean) More points in bar rectangle. Defaul is False.
- Returns:
Bar legend break.
- The following format string characters are accepted to control the hatch style:
Character
Description
‘-’
horizontal hatch style
‘|’
vertical hatch style
‘\’
forward_diagonal hatch style
‘/’
backward_diagonal hatch style
‘+’
cross hatch style
‘x’
diagonal_cross hatch style
‘.’
dot hatch style
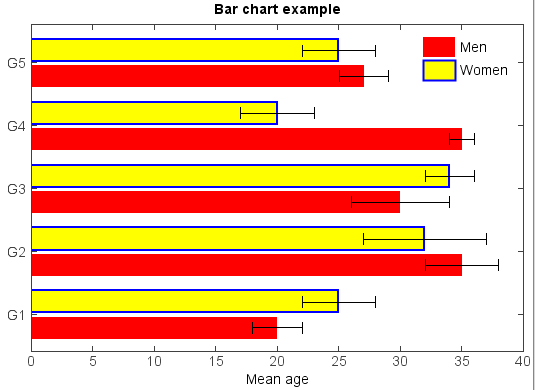
Examples:
menMeans = [20, 35, 30, 35, 27]
std_men = (2, 3, 4, 1, 2)
n = len(menMeans)
ind = arange(n)
height = 0.35
gap = 0.06
axes(outerposition=[0,0,1,1])
barh(ind, menMeans, height, xerr=std_men, color='r', label='Men', \
    edgecolor=None)

womenMeans = [25, 32, 34, 20, 25]
std_women = (3, 5, 2, 3, 3)
barh(ind + height + gap, womenMeans, height, xerr=std_women, color='y', \
    label='Women', edgecolor='b', linewidth=2)

ylim(-0.2, 5)
xlim(0, 40)
xlabel('Mean age')
yticks(ind + height + gap * 0.5, ['G1','G2','G3','G4','G5'])
legend(markerscale=2, frameon=False)
title('Bar chart example')