boxplot
- mipylib.plotlib.miplot.boxplot(x, sym=None, positions=None, widths=None, color=None, showcaps=True, showfliers=True, showmeans=False, meanline=False, boxprops=None, medianprops=None, meanprops=None, whiskerprops=None, capprops=None, flierprops=None)
Make a box and whisker plot.
Make a box and whisker plot for each column of x or each vector in sequence x. The box extends from lower to upper quartile values of the data, with a line at the median. The whiskers extend from the box to show the range of the data. Flier points are those past the end of the whiskers.
- Parameters:
x – (Array or a sequence of vectors) The input data.
sym – (string) The default symbol for flier points. Enter an empty string (‘’) if you don’t want to show fliers. If None, then the fliers default to ‘b+’ If you want more control use the flierprops kwarg.
positions – (array_like) Sets the positions of the boxes. The ticks and limits are automatically set to match the positions. Defaults to range(1, N+1) where N is the number of boxes to be drawn.
widths – (scalar or array_like) Sets the width of each box either with a scalar or a sequence. The default is 0.5, or 0.15*(distance between extreme positions), if that is smaller.
color – (Color) Color for all parts of the box plot. Defaul is None.
showcaps – (boolean) Show the caps on the ends of whiskers. Default is
True.showfliers – (boolean) Show the outliers beyond the caps. Defaul is
True.showmeans – (boolean) Default is
False. Show the mean or not.meanline – (boolean) Default is
False. IfTrue(and showmeans isTrue), will try to render the mean as a line spanning. Otherwise, means will be shown as points.boxprops – (dict) Specifies the style of the box.
medianprops – (dict) Specifies the style of the median.
meanprops – (dict) Specifies the style of the mean.
whiskerprops – (dict) Specifies the style of the whiskers.
capprops – (dict) Specifies the style of the caps.
flierprops – (dict) Specifies the style of the fliers.
Examples:
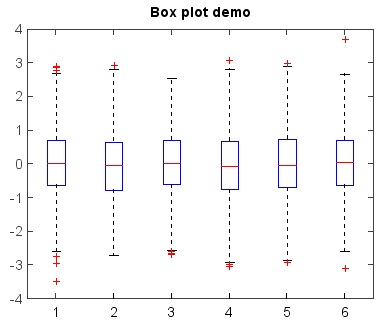
data = []
for i in range(6):
    data.append(random.randn(500))
boxplot(data)
title('Box plot demo')