grid
- mipylib.plotlib.miplot.grid(b=None, which='major', axis='both', **kwargs)
Turn the aexs grids on or off.
- Parameters:
b – If b is None and len(kwargs)==0 , toggle the grid state. If kwargs are supplied, it is assumed that you want a grid and b is thus set to True .
which – which can be ‘major’ (default), ‘minor’, or ‘both’ to control whether major tick grids, minor tick grids, or both are affected.
axis – axis can be ‘both’ (default), ‘x’, or ‘y’ to control which set of gridlines are drawn.
kwargs – kwargs are used to set the grid line properties.
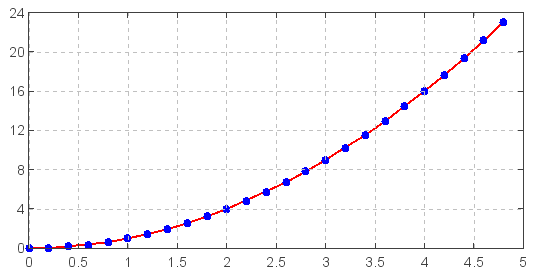
Example:
x = arange(0., 5., 0.2)
y = x**2
plot(x, y, label='Series_1', linewidth=2.0)
plot(x, y, 'bo')
grid()