hist
- mipylib.plotlib.miplot.hist(x, bins=10, **kwargs)
Plot a histogram.
- Parameters:
x – (array_like) Input values, this takes either a single array or a sequency of arrays which are not required to be of the same length.
bins – (int) If an integer is given, bins + 1 bin edges are returned.
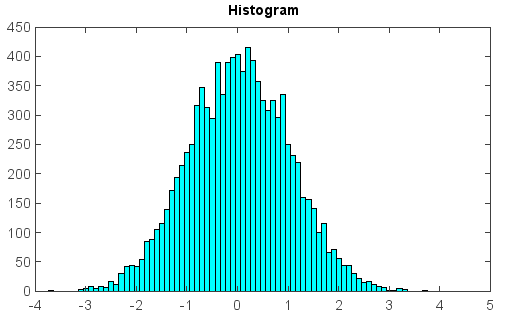
Examples:
x = random.randn(10000)
hist(x, bins=50, color='c')
title('Histogram')