plot
- mipylib.plotlib.miplot.plot(*args, **kwargs)
Plot lines and/or markers to the axes. args is a variable length argument, allowing for multiple x, y pairs with an optional format string.
- Parameters:
x – (array_like) Input x data.
y – (array_like) Input y data.
style – (string) Line style for plot.
- Returns:
Legend breaks of the lines.
The following format string characters are accepted to control the line style or marker:
Character
Description
‘-’
solid line style
‘–’
dashed line style
‘-.’
dash-dot line style
‘:’
dotted line style
‘.’
point marker
‘,’
pixel marker
‘o’
circle marker
‘v’
triangle_down marker
‘^’
triangle_up marker
‘<’
triangle_left marker
‘>’
triangle_right marker
‘s’
square marker
‘p’
pentagon marker
‘*’
star marker
‘x’
x marker
‘D’
diamond marker
The following color abbreviations are supported:
Character
Color
‘b’
blue
‘g’
green
‘r’
red
‘c’
cyan
‘m’
magenta
‘y’
yellow
‘k’
black
Examples:
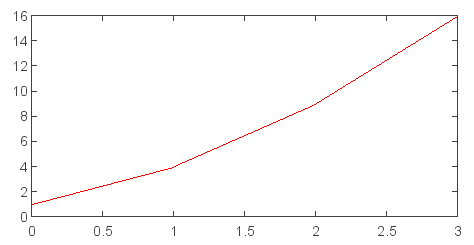
y = [1,4,9,16]
plot(y)    # plot y using x as index array 0..N-1
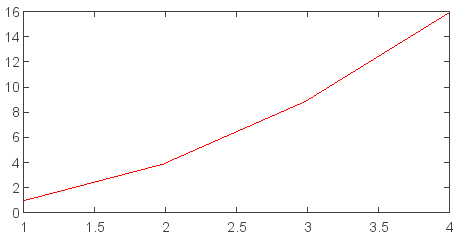
x = [1,2,3,4]
y = [1,4,9,16]
plot(x, y)    # plot x and y using default line style and color
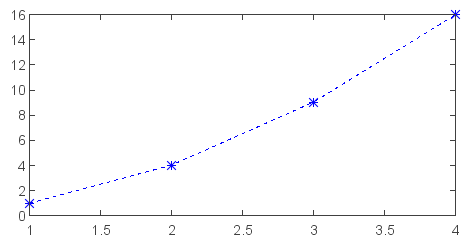
x = [1,2,3,4]
y = [1,4,9,16]
plot(x, y, 'b--*')    # plot x and y using blue dash line and star marker style
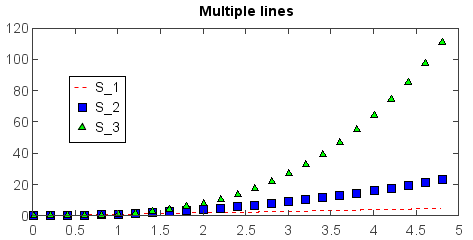
t = arange(0., 5., 0.2)
plot(t, t, 'r--', t, t**2, 'bs', t, t**3, 'g^')
legend(loc='custom',x=0.2,y=0.4)
title('Multiple lines')