pie
- pie(x, explode=None, labels=None, colors=None, autopct=None, pctdistance=0.6, shadow=False,
- labeldistance=1.1, startangle=0, radius=None, hold=None, **kwargs)
Plot a pie chart.
Make a pie chart of array x. The fraction area of each wedge is given by x/sum(x). If sum(x) <= 1, then the values of x give the fractional area directly and the array will not be normalized. The wedges are plotted counterclockwise, by default starting from the x-axis.
- Parameters:
explode – (None | len(x)sequence) If not *None, is a
len(x)array which specifies the fraction of the radius with which to offset each wedge.labels – (None | len(x) sequence of colors] A sequence of strings providing the labels for each wedge.
colors – (None | color sequence) A sequence of color args through which the pie chart will cycle.
autopct – (None | format string | format function) If not *None, is a string or function used to label the wedges with their numeric value. The label will be placed inside the wedge. If it is a format string, the label will be
fmt%pct. If it is a function, it will be called.pctdistance – (float) The ratio between the center of each pie slice and the start of the text generated by autopct. Ignored if autopct is None; default is 0.6.
labeldistance – (float) The ratial distance at which the pie labels are drawn.
shadow – (boolean) Draw a shadow beneath the pie.
startangle – (float) If not 0, rotates the start of the pie chart by angle degrees counterclockwise from the x-axis.
fontname – (string) Font name. Default is
Arial.fontsize – (int) Font size. Default is
14.
- Radius:
(float) The radius of the pie, if radius is None it will be set to 1.
- Returns:
(tuple) Patches and texts.
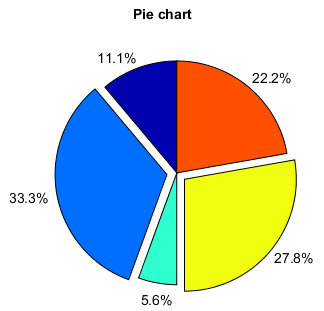
Examples:
x = [1, 3, 0.5, 2.5, 2]
pie(x, explode=[0,1,0,1,0], startangle=90, autopct='%.1f%%')
title('Pie chart')