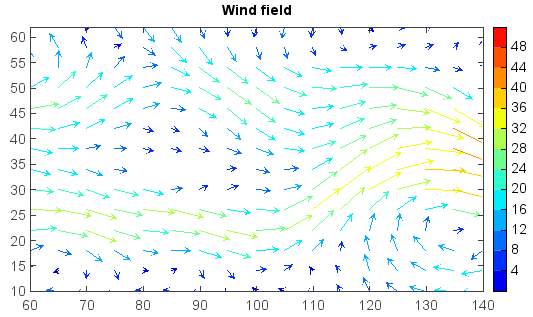
quiver
- mipylib.plotlib.miplot.quiver(*args, **kwargs)
Plot a 2-D field of arrows.
- Parameters:
x – (array_like) Optional. X coordinate array.
y – (array_like) Optional. Y coordinate array.
u – (array_like) U component of the arrow vectors (wind field) or wind direction.
v – (array_like) V component of the arrow vectors (wind field) or wind speed.
z – (array_like) Optional, 2-D z value array.
cmap – (string) Color map string.
fill_value – (float) Fill_value. Default is
-9999.0.isuv – (boolean) Is U/V or direction/speed data array pairs. Default is True.
size – (float) Base size of the arrows.
order – (int) Z-order of created layer for display.
- Returns:
(VectoryLayer) Created quiver VectoryLayer.
Example:
f = addfile('D:/Temp/GrADS/model.ctl')
u = f['U'][0,'500','10:60','60:140']
v = f['V'][0,'500','10:60','60:140']
speed = sqrt(u*u+v*v)
layer = quiver(u, v, speed, 10, size=8)
title('Wind field')
colorbar(layer)