quiverkey
- mipylib.plotlib.miplot.quiverkey(*args, **kwargs)
Add a key to a quiver plot.
- Parameters:
Q – (MILayer) The quiver layer instance returned by a call to quiver/quiverm.
X – (float) The location x of the key.
Y – (float) The location y of the key.
label – (string) A string with the length and units of the key.
coordinates=['axes'|'figure'|'data'|'inches'] – (string) Coordinate system and units for X, Y. ‘axes’ and ‘figure’ are normalized coordinate system with 0,0 in the lower left and 1,1 in the upper right, ‘data’ are the axes data coordinates (used for the locations of the vectors in the quiver plot itself); ‘inches’ is position in the figure in inches, with 0,0 at the lower left corner.
color – (Color) Overrides face and edge colors from Q.
labelpos=['N'|'S'|'E'|'W'] – (string) Position the label above, below, to the right, to the left of the arrow, respectively.
labelsep – (float) Distance in inches between the arrow and the label. Default is 0.1.
labelcolor – (Color) Label color. Default to default is black.
fontproperties – (dict) A dictionary with keyword arguments accepted by the FontProperties initializer: family, style, variant, size, weight.
Example:
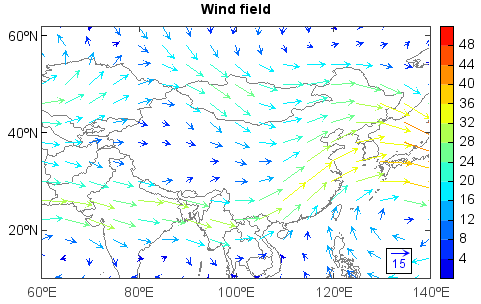
f = addfile('D:/Temp/GrADS/model.ctl')
u = f['U'][0,'500','10:60','60:140']
v = f['V'][0,'500','10:60','60:140']
speed = sqrt(u*u+v*v)
#Plot
axesm()
lworld = shaperead('D:/Temp/Map/country1.shp')
geoshow(lworld)
layer = quiverm(u, v, speed, 10, size=8)
quiverkey(layer, 0.74, 0.18, 15, bbox={'edge':True, 'fill':True})
colorbar(layer)
title('Wind field')
yticks([20,40,60])