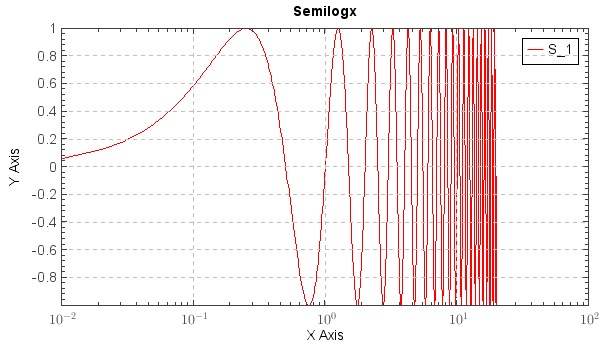
semilogx
- mipylib.plotlib.miplot.semilogx(*args, **kwargs)
Make a plot with log scaling on x axis.
- Parameters:
x – (array_like) Input x data.
y – (array_like) Input y data.
style – (string) Line style for plot.
- Returns:
Legend breaks of the lines.
Examples:
t = arange(0.01, 20.0, 0.01)
semilogx(t, sin(2*pi*t))
grid(True)
ylabel('Y Axis')
xlabel('X Axis')
legend()
set(plt.gca, xminortick=True, yminortick=True)
title('Semilogx')