scatterm
- mipylib.plotlib.miplot.scatterm(*args, **kwargs)
Make a scatter plot on a map.
- Parameters:
x – (array_like) Input x data.
y – (array_like) Input y data.
z – (array_like) Input z data.
levs – (array_like) Optional. A list of floating point numbers indicating the level curves to draw, in increasing order.
cmap – (string) Color map string.
colors – (list) If None (default), the colormap specified by cmap will be used. If a string, like ‘r’ or ‘red’, all levels will be plotted in this color. If a tuple of matplotlib color args (string, float, rgb, etc), different levels will be plotted in different colors in the order specified.
size – (int) Marker size.
marker – (string) Marker of the points.
fill – (boolean) Fill markers or not. Default is True.
edge – (boolean) Draw edge of markers or not. Default is True.
facecolor – (Color) Fill color of markers. Default is black.
edgecolor – (Color) Edge color of markers. Default is black.
fill_value – (float) Fill_value. Default is
-9999.0.proj – (ProjectionInfo) Map projection of the data. Default is None.
order – (int) Z-order of created layer for display.
- Returns:
(VectoryLayer) Point VectoryLayer.
Examples:
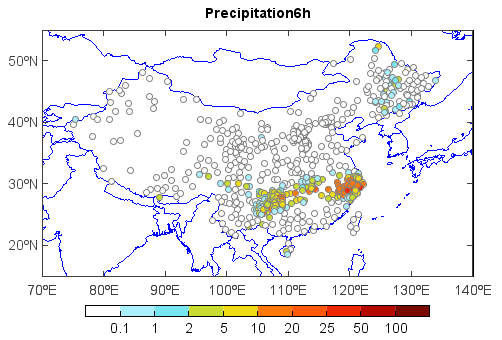
f = addfile_micaps('D:/Temp/micaps/10101414.000')
vname = 'Precipitation6h'
pr = f[vname][:]
lon = f['Longitude'][:]
lat = f['Latitude'][:]
layer = shaperead('D:/Temp/map/china.shp')
pr, lon, lat = rmaskout(pr, lon, lat, layer.shapes())
axesm()
mlayer = shaperead('D:/Temp/map/country1.shp')
geoshow(mlayer, edgecolor=(0,0,255))
levs = [0.1, 1, 2, 5, 10, 20, 25, 50, 100]
cols = [(255,255,255),(170,240,255),(120,230,240),(200,220,50),(240,220,20),(255,120,10),(255,90,10), \
    (240,40,0),(180,10,0),(120,10,0)]
layer = scatterm(lon, lat, pr, levs, colors = cols, s=2, edgecolor='gray')
title(vname)
yticks(arange(20, 51, 10))
xlim(70, 140)
ylim(15, 55)
colorbar(layer, orientation='horizontal', shrink=0.8, aspect=30)