stationmodel
- mipylib.plotlib.miplot.stationmodel(smdata, **kwargs)
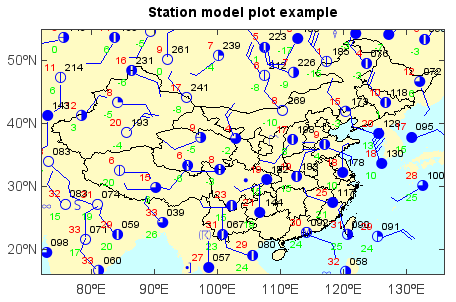
Plot station model data on the map.
- Parameters:
smdata – (StationModelData) Station model data.
surface – (boolean) Is surface data or not. Default is True.
size – (float) Size of the station model symbols. Default is 12.
proj – (ProjectionInfo) Map projection of the data. Default is None.
order – (int) Z-order of created layer for display.
- Returns:
(VectoryLayer) Station model VectoryLayer.
Examples
#Set data folders
basedir = 'D:/MyProgram/Distribution/java/MeteoInfo/MeteoInfo'
datadir = os.path.join(basedir, 'sample/MICAPS')
mapdir = os.path.join(basedir, 'map')
#Read shape files
lworld = shaperead(os.path.join(mapdir, 'country1.shp'))
lchina = shaperead(os.path.join(mapdir, 'bou2_4p.shp'))
#Read station data
f = addfile_micaps(os.path.join(datadir, '10101414.000'))
data = f.smodeldata()
#Plot
axesm(bgcolor=(204,255,255))
geoshow(lworld, facecolor=(255,251,195))
geoshow(lchina, edgecolor='k')
layer = stationmodel(data, size=14)
yticks([20,30,40,50])
title('Station model plot example')
xlim(72, 136)
ylim(16, 55)