stem
- mipylib.plotlib.miplot.stem(*args, **kwargs)
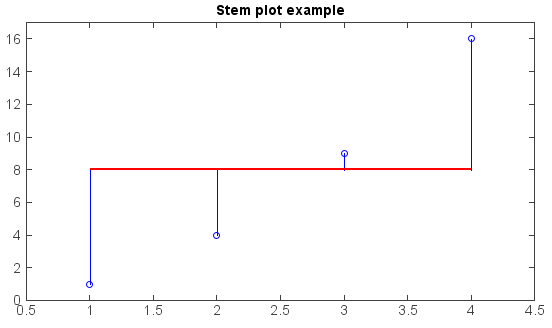
Make a stem plot.
A stem plot plots vertical lines at each x location from the baseline to y, and places a marker there.
- param x:
(array_like) The x-positions of the stems.
- param y:
(array_like) The y-values of the stem heads.
- param bottom:
(array_like) Optional, The y-position of the baseline.
- param linefmt:
(dict) Optional, stem line format.
- param markerfmt:
(dict) Optional, stem marker format.
- param color:
(Color) Optional, the color of the stem.
- returns:
Stem line legend break.
Examples:
x = [1,2,3,4]
y = [1,4,9,16]
stem(x, y, color='b', bottom=8, basefmt={'color':'r','size':2})
title('Stem plot example')
xlim(0.5, 4.5)
ylim(0, 17)