streamplotm
- mipylib.plotlib.miplot.streamplotm(*args, **kwargs)
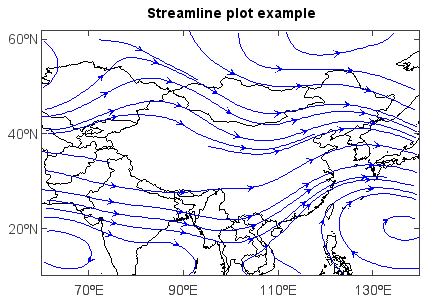
Plot streamline in a map.
- Parameters:
x – (array_like) Optional. X coordinate array.
y – (array_like) Optional. Y coordinate array.
u – (array_like) U component of the arrow vectors (wind field) or wind direction.
v – (array_like) V component of the arrow vectors (wind field) or wind speed.
z – (array_like) Optional, 2-D z value array.
color – (Color) Streamline color. Default is blue.
fill_value – (float) Fill_value. Default is
-9999.0.isuv – (boolean) Is U/V or direction/speed data array pairs. Default is True.
density – (int) Streamline density. Default is 4.
proj – (ProjectionInfo) Map projection of the data. Default is None.
order – (int) Z-order of created layer for display.
- Returns:
(VectoryLayer) Created streamline VectoryLayer.
Example:
f = addfile('D:/Temp/GrADS/model.ctl')
u = f['U'][0,'500','10:60','60:140']
v = f['V'][0,'500','10:60','60:140']
axesm()
mlayer = shaperead('D:/Temp/map/country1.shp')
geoshow(mlayer, edgecolor='k')
layer = streamplotm(u, v)
title('Streamline plot example')
yticks([20,40,60])