step
- mipylib.plotlib.miplot.step(x, y, *args, **kwargs)
Make a step plot.
- Parameters:
x – (array_like) Input x data.
y – (array_like) Input y data.
style – (string) Line style for plot.
label – (string) Step line label.
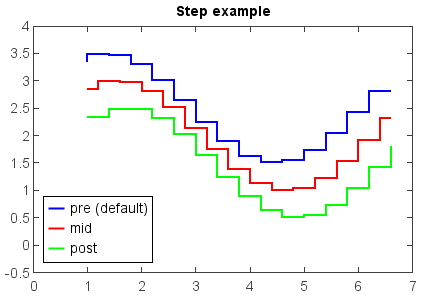
where – (string) [‘pre’ | ‘post’ | ‘mid’]. If ‘pre’ (the default), the interval from x[i] to x[i+1] has level y[i+1]. If ‘post’, that interval has level y[i]. If ‘mid’, the jumps in y occur half-way between the x-values.
- Returns:
Step lines
Examples:
x = arange(1, 7, 0.4)
y0 = sin(x)
y = y0 + 2.5
step(x, y, label='pre (default)', color='b', linewidth=2)
y -= 0.5
step(x, y, where='mid', label='mid', color='r', linewidth=2)
y -= 0.5
step(x, y, where='post', label='post', color='g', linewidth=2)
legend(loc='lower left')
xlim(0, 7)
ylim(-0.5, 4)
title('Step example')