title
- mipylib.plotlib.miplot.title(title, fontname='Arial', fontsize=14, bold=True, color='black')
Set a title of the current axes.
- Parameters:
title – (string or list) Title string.
fontname – (string) Font name. Default is
Arial.fontsize – (int) Font size. Default is
14.bold – (boolean) Is bold font or not. Default is
True.color – (color) Title string color. Default is
black.
Example:
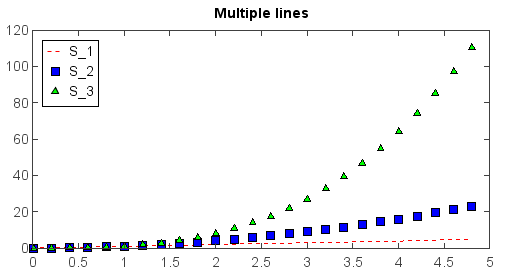
t = arange(0., 5., 0.2)
plot(t, t, 'r--', t, t**2, 'bs', t, t**3, 'g^')
legend(loc='upper left')
title('Multiple lines')
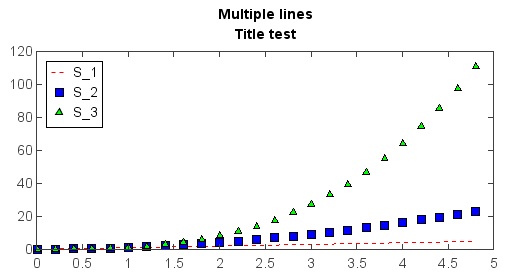
Multiple rows title can be added using string list:
t = arange(0., 5., 0.2)
plot(t, t, 'r--', t, t**2, 'bs', t, t**3, 'g^')
legend(loc='upper left')
title(['Multiple lines', 'Title test'])