twinx
- mipylib.plotlib.miplot.twinx(ax)
Make a second axes that shares the x-axis. The new axes will overlay ax. The ticks for ax2 will be placed on the right, and the ax2 instance is returned.
- Parameters:
ax – Existing axes.
- Returns:
The second axes
Example:
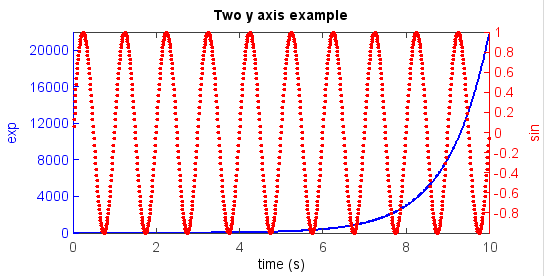
Two y axis:
ax1 = axes()
yaxis(ax1, color='b')
t = arange(0.01, 10.0, 0.01)
s1 = exp(t)
plot(t, s1, 'b-', linewidth=2)
xlabel('time (s)')
ylabel('exp', color='b')
title('Two y axis example')

ax2 = twinx(ax1)
yaxis(ax2, color='r')
s2 = sin(2*pi*t)
plot(t, s2, 'r.')
ylabel('sin', color='r')
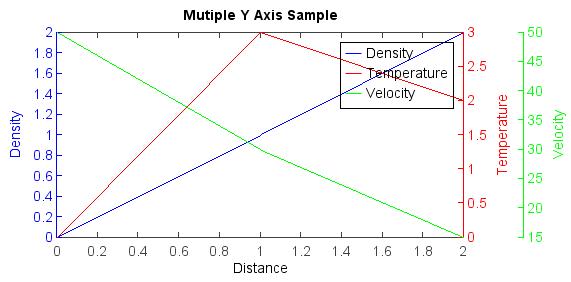
Multiple y axis:
ax1 = axes(position=[0.113,0.15,0.7,0.8])
yaxis(ax1, color='b')
line1 = plot([0, 1, 2], [0, 1, 2], 'b-', label="Density")
xlabel('Distance')
ylabel('Density', color='b')
title('Mutiple Y Axis Sample')

ax2 = twinx(ax1)
yaxis(ax2, color='r')
line2 = plot([0, 1, 2], [0, 3, 2], 'r-', label="Temperature")
ylabel('Temperature', color='r')

ax3 = twinx(ax1)
yaxis(ax3, shift=60, color='g')
line3 = plot([0, 1, 2], [50, 30, 15], 'g-', label="Velocity")
ylabel('Velocity', color='g')
lines = [line1, line2, line3]
legend(lines)