violinplot
- mipylib.plotlib.miplot.violinplot(dataset, positions=None, widths=0.5, boxwidth=0.01, boxprops=None, whiskerprops=None, **kwargs)
Make a violin plot.
- Parameters:
dateset – (Array or a sequence of vectors) The input data.
positions – (array_like) Sets the positions of the violins. The ticks and limits are automatically set to match the positions. Defaults to range(1, N+1) where N is the number of violins to be drawn.
widths – (scalar or array_like) Sets the width of each box either with a scalar or a sequence. The default is 0.5, or 0.15*(distance between extreme positions), if that is smaller.
boxwidth – (float) box width.
boxprops – (dict) Specifies the style of the box.
whiskerprops – (dict) Specifies the style of the whiskers.
- Returns:
Violin graphics.
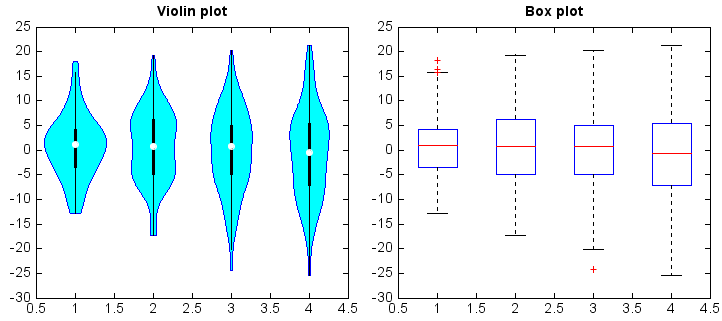
Examples:
all_data = [np.random.normal(0, std, 100) for std in range(6, 10)]

fig,(ax1,ax2) = plt.subplots(nrows=1,ncols=2)
ax1.violinplot(all_data, widths=0.4, boxwidth=0.02)
ax1.set_title('Violin plot')
ax2.boxplot(all_data)
ax2.set_title('Box plot')