windrose
- mipylib.plotlib.miplot.windrose(wd, ws, nwdbins=16, wsbins=None, degree=True, colors=None, cmap='matlab_jet', alpha=0.7, rmax=None, rtickloc=None, rticks=None, rlabelpos=60, xticks=None)
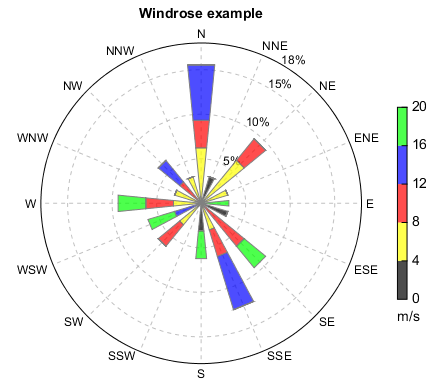
Plot windrose chart.
- Parameters:
wd – (array_like) Wind direction.
ws – (array_like) Wind speed.
nwdbins – (int) Number of wind direction bins [4 | 8 | 16].
wsbins – (array_like) Wind speed bins.
degree – (boolean) The unit of wind direction is degree or radians.
colors – (color list) The colors.
cmap – (string) Color map.
alpha – (float) Color alpha (0 - 1).
rmax – (float) Radial maximum value.
rtickloc – (list of float) Radial tick locations.
rticks – (list of string) Radial ticks.
rlabelpos – (float) Radial label position in degree.
xticks – (list of string) X ticks.
- Returns:
Polar axes and bars
Examples:
fn = r'D:\Temp\ascii\windrose.txt'
ncol = numasciicol(fn)
nrow = numasciirow(fn)
a = asciiread(fn,shape=(nrow,ncol))
ws=a[:,0]
wd=a[:,1]

n = 16
wsbins = arange(0., 21.1, 4)
cols = makecolors(['k','y','r','b','g'], alpha=0.7)
rtickloc = [0.05,0.1,0.15,0.18]
ax, bars = windrose(wd, ws, n, wsbins, rmax=0.18, colors=cols, rtickloc=rtickloc)
colorbar(bars, shrink=0.6, vmintick=True, vmaxtick=True, xshift=10, \
    label='m/s', labelloc='bottom')
title('Windrose example')