Read GRIB2 radar reflectivity data
GRIB data file can be opened using addfile() function. Then read variable data array from file object.
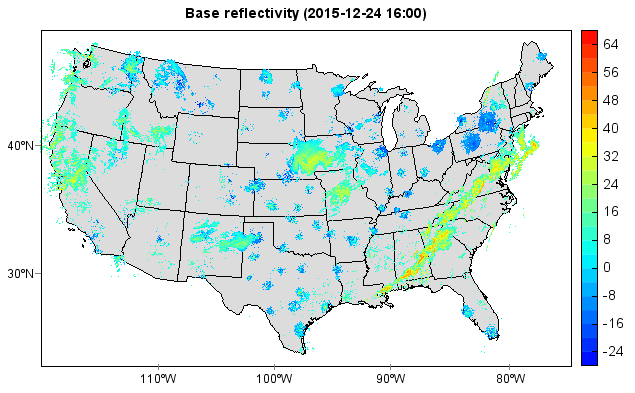
The high resolution US radar reflectivity data include big piece of missing value data. imshow()
function was applied to create a raster layer (display as an image) and plot on a map.
f = addfile('D:/Temp/grib/1kmradar_201512241600.grib2')
data = f['Base_reflectivity_surface_layer'][0,:,:]
t = f.gettime(0)
axesm(projinfo=f.proj)
lstates = shaperead('D:/Temp/Map/states.shp')
geoshow(lstates, facecolor=[220,220,220], edgecolor='k')
layer = imshow(data, 20, proj=f.proj, order=1)
colorbar(layer)
title('Base reflectivity (' + t.strftime('%Y-%m-%d %H:%M') + ')')