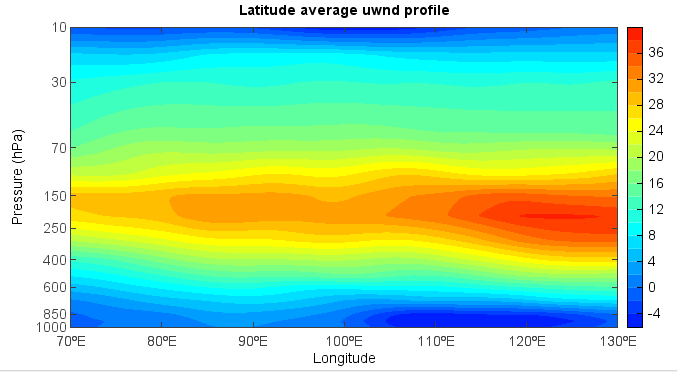
Average data along x/y axis of a rectangle
Average data along x/y axis of a ractangle, and plot vertical distribution of the average data.
f = addfile('D:/Temp/nc/uwnd.2011.nc')
data = f['uwnd'][0,:,'10:40','70:130']
data = mean(data, axis=1)
lev1 = data.dimvalue(0)
#lev2 = 1000 - lev1
lev2 = p2h(lev1)
levels = []
for i in range(0, len(lev1)):
    levels.append('%i' % lev1[i])
data.setdimvalue(0, lev2)
#Plot
layer = contourf(data, 20)
colorbar(layer)
yticks(lev2, levels)
xlabel('Longitude')
ylabel('Pressure (hPa)')
title('Latitude average uwnd profile')
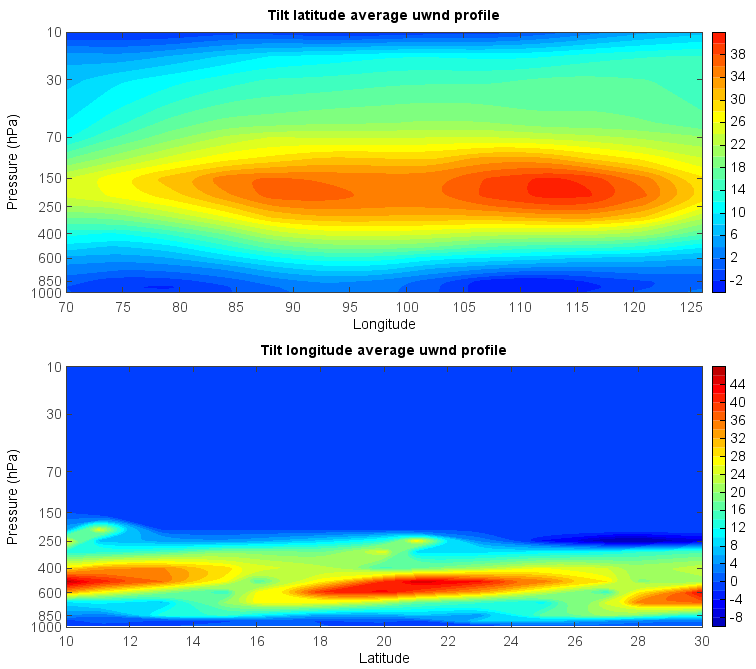
Rotated rectangle:
#Read data array
f = addfile('D:/Temp/nc/uwnd.2011.nc')
data = f['uwnd'][0,:,'0:70','50:150']

#Get rotated grid
lat = arange(10, 41, 5)
lon = arange(70, 131, 5)
xn = len(lon)
yn = len(lat)
lon, lat = meshgrid(lon, lat)
angle = 20 * pi / 180
rotate = array([[cos(angle),sin(angle)], [-sin(angle),cos(angle)]])
n = len(lon)
xy = zeros([n, 2])
xy[:,0] = lon - 70
xy[:,1] = lat - 10
xy = dot(xy, rotate)    #Matrix multiplication
xy[:,0] = xy[:,0] + 70
xy[:,1] = xy[:,1] + 10
lon[:,:] = xy[:,0]
lat[:,:] = xy[:,1]

#Project data to the grid
ndata = data.project(lon, lat)

#Average data along tilt latitude
londata = mean(ndata, axis=1)
latdata = mean(ndata, axis=2)
lev1 = data.dimvalue(0)
lev2 = p2h(lev1)
levels = []
for j in range(0, len(lev1)):
    levels.append('%i' % lev1[j])

#Plot
subplot(2,1,1)
layer = contourf(lon[0,:], lev2, londata, 20)
colorbar(layer)
yticks(lev2, levels)
xlabel('Longitude')
ylabel('Pressure (hPa)')
title('Tilt latitude average uwnd profile')

subplot(2,1,2)
layer = contourf(lat[0,:], lev2, latdata, 20)
colorbar(layer)
yticks(lev2, levels)
xlabel('Latitude')
ylabel('Pressure (hPa)')
title('Tilt longitude average uwnd profile')