Sigma to Pressure Interpolation
The example to interpolate the data with sigma as the vertical coordinate to isobaric coordinates.
f = addfile('D:/Temp/nc/wrf_example.nc')
lat = f['lat'][:,0]
lon = f['lon'][0,:]
temperature = f['temperature'][:,:,:,:]
pres = f['pressure'][:,:,:,:]
hgt = f['height'][:,:,:,:]
#Projection
proj = projinfo(proj='lcc', lon_0=-100, lat_0=45, lat_1=33, lat_2=45)
# Set the forecast hour
FH = 1
#Interpolate to a z level
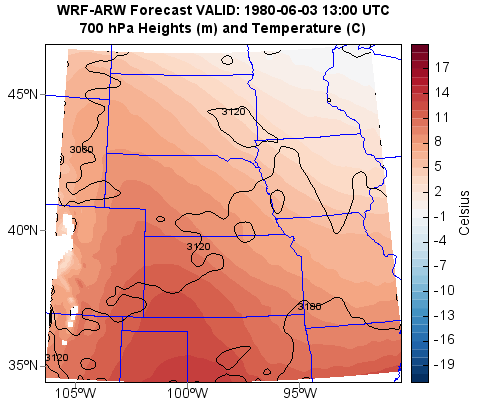
p = [70000., 80000.]
height, temp = meteo.log_interpolate_1d(p, pres, hgt, temperature, axis=1)
#Plot
axesm(projinfo=proj, griddx=5, griddy=5)
geoshow('D:/Temp/map/states.shp', edgecolor='b')
geoshow('country', edgecolor=(0,0,255))
levs = arange(-20, 20, 1)
cols = makecolors(len(levs)+1, 'MPL_RdBu', reverse=True)
layer = contourf(lon, lat, temp[FH,0,:,:], levs, colors=cols, proj=f.proj)
colorbar(layer, label='Celsius')
cs = contour(lon, lat, height[FH,0,:,:], arange(2880,4000,60), colors='k', proj=f.proj)
clabel(cs, fontsize=10, drawshadow=False)
t = f.gettime(FH)
title('WRF-ARW Forecast VALID: %s UTC' % t.strftime('%Y-%m-%d %H:00') + \
'\n700 hPa Heights (m) and Temperature (C)')