Violin chart
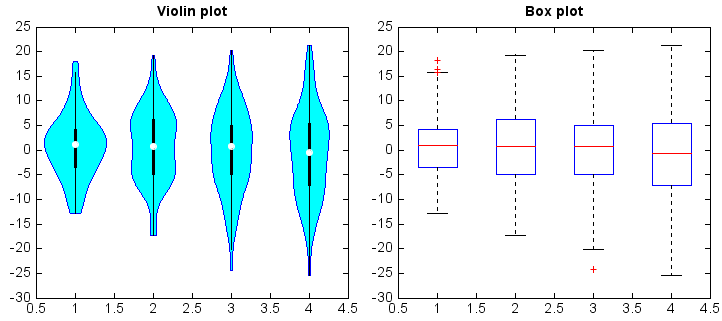
Violin chart was created by violinplot() function.
all_data = [np.random.normal(0, std, 100) for std in range(6, 10)]

fig,(ax1,ax2) = plt.subplots(nrows=1,ncols=2)
ax1.violinplot(all_data, widths=0.4, boxwidth=0.02)
ax1.set_title('Violin plot')
ax2.boxplot(all_data)
ax2.set_title('Box plot')