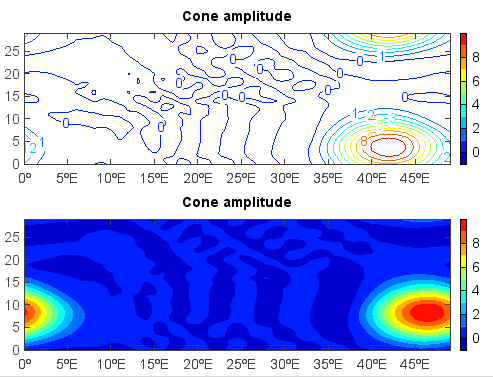
Contour plot
Contour plot was created by contour() function. contourf() function is for filled
contour plot.
f = addfile('D:/Temp/nc/cone.nc')
u = f['u'][4,:,:]
subplot(2,1,1)
layer = contour(u)
clabel(layer)
title('Cone amplitude')
colorbar(layer)

subplot(2,1,2)
u = f['u'][5,:,:]
layer = contourf(u)
title('Cone amplitude')
colorbar(layer)
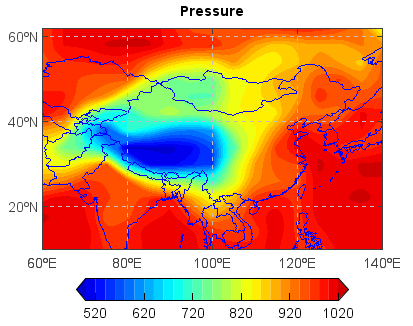
Contour plot for map axes.
fn = os.path.join(migl.get_sample_folder(), 'GrADS', 'model.ctl')
f = addfile(fn)
psv = f['PS']
ps = psv[0,'10:60','60:140']
axesm()
geoshow('country', edgecolor=(0,0,255))
#layer = contour(ps, 20)
layer = contourf(ps, 20)
title('Pressure')
yticks(arange(20, 61, 20))
grid()
colorbar(layer, orientation='horizontal', extendrect=False, shrink=0.8, aspect=12)