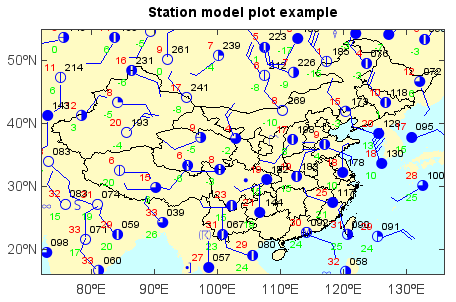
Station model plot
Station model plot was created by stationmodel() function from station model data object
read by smodeldata() function of DimDataFile object.
fn = os.path.join(migl.get_sample_folder(), 'MICAPS', '10101414.000')
f = addfile_micaps(fn)
data = f.smodeldata()
#Plot
axesm(bgcolor=(204,255,255))
geoshow('country', facecolor=(255,251,195))
geoshow('cn_province', edgecolor='k')
layer = stationmodel(data, size=14)
yticks([20,30,40,50])
title('Station model plot example')
xlim(72, 136)
ylim(16, 55)