Adaptive Boosting
In principle, AdaBoost (Adaptive Boosting) is a meta-algorithm, and can be used in conjunction with many other learning algorithms to improve their performance. In practice, AdaBoost with decision trees is probably the most popular combination. AdaBoost is adaptive in the sense that subsequent classifiers built are tweaked in favor of those instances misclassified by previous classifiers. AdaBoost is sensitive to noisy data and outliers. However in some problems it can be less susceptible to the over-fitting problem than most learning algorithms.
from miml import datasets
from miml.classification import AdaBoost
fn = os.path.join(datasets.get_data_home(), 'classification', 'toy',
'toy-test.txt')
df = DataFrame.read_table(fn, header=None, names=['x1','x2'],
format='%2f', index_col=0)
X = df.values
y = array(df.index.data)
model = AdaBoost(ntrees=100)
model.fit(X, y)
# Plot the decision boundary. For that, we will assign a color to each
# point in the mesh [x_min, x_max]x[y_min, y_max].
x_min, x_max = X[:, 0].min() - 1, X[:, 0].max() + 1
y_min, y_max = X[:, 1].min() - 1, X[:, 1].max() + 1
n = 50 # size in the mesh
xx, yy = np.meshgrid(np.linspace(x_min, x_max, n),
np.linspace(y_min, y_max, n))
data = np.vstack((xx.flatten(), yy.flatten())).T
Z = model.predict(data)
# Put the result into a color plot
Z = Z.reshape(xx.shape)
#Plot
# Create color maps
cmap_light = ['#FFAAAA', '#AAAAFF']
cmap_bold = ['#FF0000', '#0000FF']
imshow(xx[0,:], yy[:,0], Z, colors=cmap_light)
# Plot also the training points
ls = plt.scatter(X[:, 0], X[:, 1], c=y,
edgecolor=None, s=3, levels=[0,1], colors=cmap_bold)
plt.contour(xx[0,:], yy[:,0], Z, [0.5], color='k', smooth=False)
plt.xlim(xx.min(), xx.max())
plt.ylim(yy.min(), yy.max())
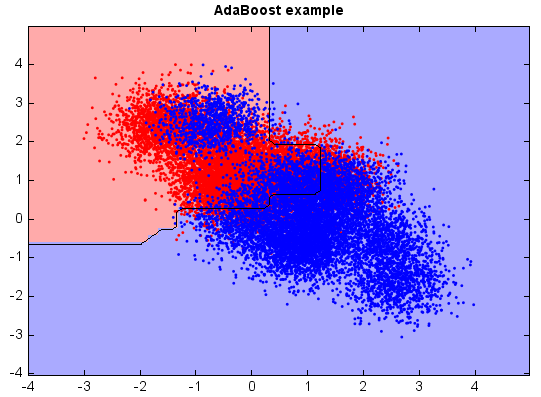
plt.title("AdaBoost example")