Gradient boosted trees
The idea of gradient boosting originated in the observation that boosting can be interpreted as an optimization algorithm on a suitable cost function. In particular, the boosting algorithms can be abstracted as iterative functional gradient descent algorithms. That is, algorithms that optimize a cost function over function space by iteratively choosing a function (weak hypothesis) that points in the negative gradient direction Gradient boosting is typically used with CART regression trees of a fixed size as base learners.
from miml import datasets
from miml.classification import GradientTreeBoost
fn = os.path.join(datasets.get_data_home(), 'classification', 'toy',
'toy-test.txt')
df = DataFrame.read_table(fn, header=None, names=['x1','x2'],
format='%2f', index_col=0)
X = df.values
y = array(df.index.data)
model = GradientTreeBoost(ntrees=100)
model.fit(X, y)
# Plot the decision boundary. For that, we will assign a color to each
# point in the mesh [x_min, x_max]x[y_min, y_max].
x_min, x_max = X[:, 0].min() - 1, X[:, 0].max() + 1
y_min, y_max = X[:, 1].min() - 1, X[:, 1].max() + 1
n = 50 # size in the mesh
xx, yy = np.meshgrid(np.linspace(x_min, x_max, n),
np.linspace(y_min, y_max, n))
data = np.vstack((xx.flatten(), yy.flatten())).T
Z = model.predict(data)
# Put the result into a color plot
Z = Z.reshape(xx.shape)
#Plot
# Create color maps
cmap_light = ['#FFAAAA', '#AAAAFF']
cmap_bold = ['#FF0000', '#0000FF']
imshow(xx[0,:], yy[:,0], Z, colors=cmap_light)
# Plot also the training points
ls = plt.scatter(X[:, 0], X[:, 1], c=y,
edgecolor=None, s=3, levels=[0,1], colors=cmap_bold)
plt.contour(xx[0,:], yy[:,0], Z, [0.5], color='k', smooth=False)
plt.xlim(xx.min(), xx.max())
plt.ylim(yy.min(), yy.max())
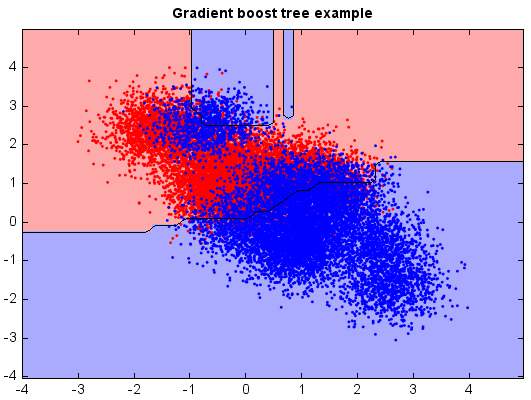
plt.title("Gradient boost tree example")