MeteoInfo 1.3.7 was released (2016-11-20)
MeteoInfo 1.3.7 was released. Log scaling axis plot functions of loglog, semilogx and semilogy
were added. This version can write bufr data file.
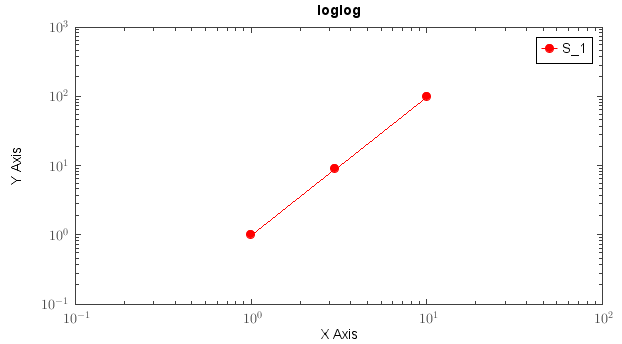
x = [1,3,10]
y = [1,9,100]
loglog(x, y, 'r-o')
ylabel('Y Axis')
xlabel('X Axis')
xlim(1e-1, 1e2)
ylim(1e-1, 1e3)
legend()
set(plt.gca, xminortick=True, yminortick=True)
title('loglog')