MeteoInfo 1.3.8 was released (2016-11-29)
MeteoInfo 1.3.8 was released. hist, pie and boxplot functions are added.
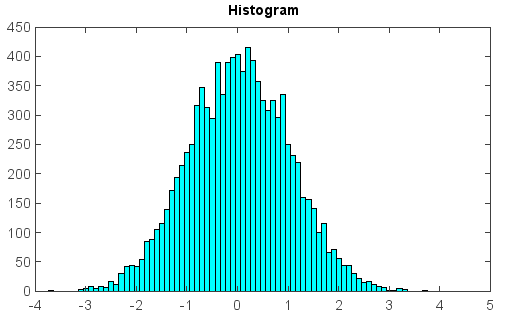
x = random.randn(10000)
hist(x, bins=50, color='c')
title('Histogram')
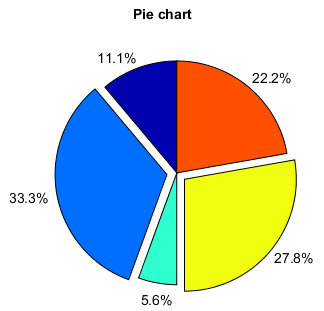
x = [1, 3, 0.5, 2.5, 2]
pie(x, explode=[0,1,0,1,0], startangle=90, autopct='%.1f%%')
title('Pie chart')
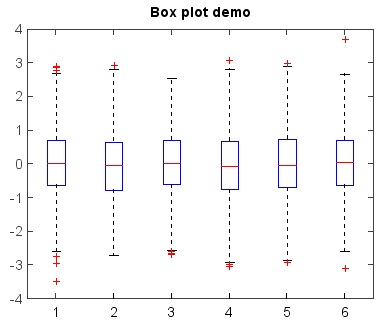
data = []
for i in range(6):
    data.append(random.randn(500))
boxplot(data)
title('Box plot demo')