MeteoInfo 1.8 was released (2019-4-22)
Add
any,all,vstackandhstackfunctions innumericpackage.Add
delnan,smooth5andsmooth9functions innumericpackage.Add
arrow,arrowline,annotatefunctions inplotlibpackage.Add
minorticknumandtickwidtharguments inxaxisandyaxisfunctions.Use itext as pdf output library for better pdf image output.
add more distributions in random module.
Update high dpi image output functions.
Fixed some bugs.
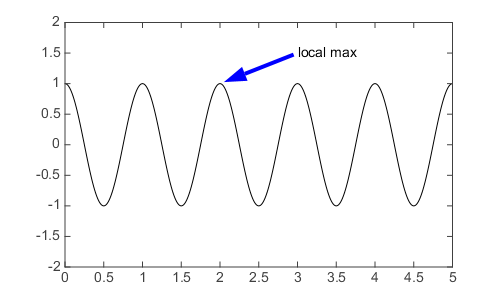
Annotate:
x = arange(0.0, 5.0, 0.01)
y = cos(2 * pi * x)
plot(x, y, lw = 2)
annotate('local max', (2,1), (3,1.5), yalign='center',
    arrowprops=dict(linewidth=4, headwidth=15, color='b', shrink=0.05))
ylim(-2, 2)
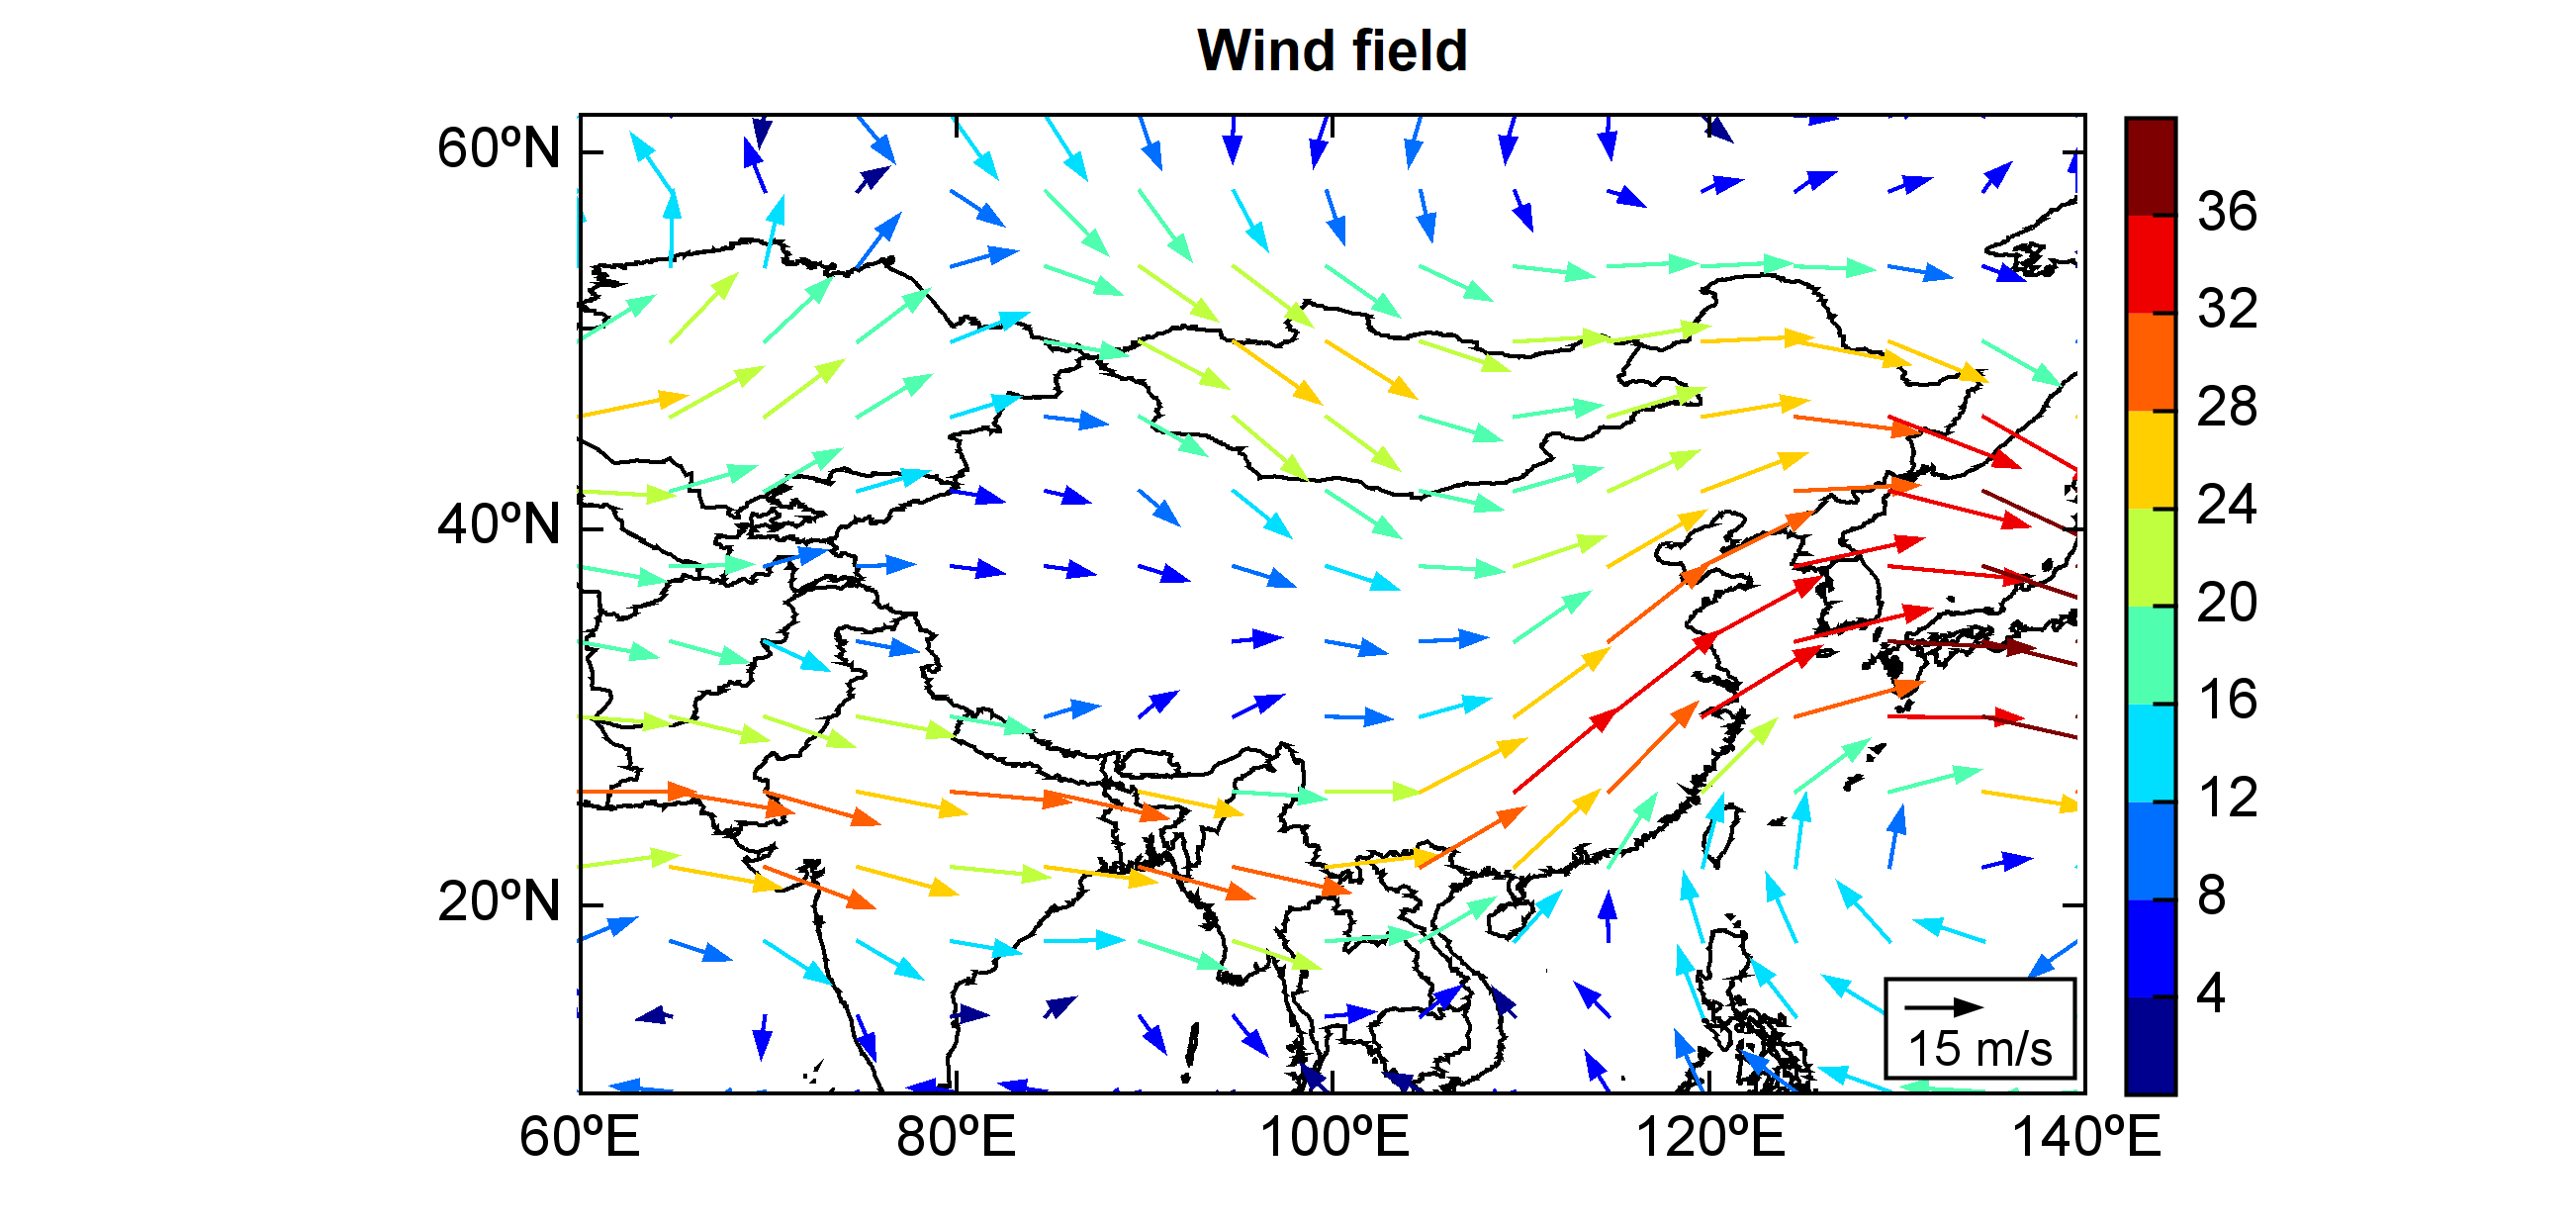
High dpi image output:
f = addfile('D:/Temp/GrADS/model.ctl')
u = f['U'][0,'500','10:60','60:140']
v = f['V'][0,'500','10:60','60:140']
speed = sqrt(u*u+v*v)

#Plot
axesm()
geoshow('country', edgecolor='k')
levs = arange(4, 40, 4)
layer = quiverm(u, v, speed, levs=levs, size=8, width=1, \
    headwidth=5, overhang=0)
quiverkey(layer, 0.74, 0.18, 15, '15 m/s', overhang=0, bbox={'edge':True, 'fill':True})
colorbar(layer)
title('Wind field')
yticks([20,40,60])
savefig('D:/Temp/dpi_test_wind.png', dpi=300)