MeteoInfo 2.2 was released (2020-4-17)
Update Jython to version 2.7.2.
Update time package as Java 8 time package.
Add 3D particle and slice plot functions.
Add
FlatLaflook and feel.Add
gridareafunction inmigeomodule for grid cell area calculation.Update bufr data reading functions and add CMA bufr lookup file.
Add
ArrayDateclass forLocalDateTimedata array.Add getting coordinates array functions for map layer.
Update grid data projection function - from backward to forward.
Add group path in variable name to avoid name conflict.
Add
splitandarray_splitfunctions innumericmodule.Add
delfigfunction inmiplotmodule.Add
bincreatefunction inmidatamodule.
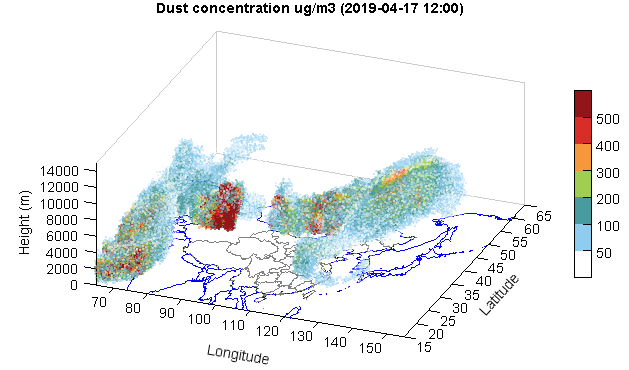
3D particle plot:
#Set date
sdate = datetime.datetime(2019, 4, 15, 0)

#Set directory
datadir = 'D:/Temp/mm5'

#Read data
fn = os.path.join(datadir, 'WMO_SDS-WAS_Asian_Center_Model_Forecasting_CUACE-DUST_CMA_'+ sdate.strftime('%Y%m%d%H') + '.nc')
f = addfile(fn)
st = f.gettime(0)
t = 20
dust = f['CONC_DUST'][t]
levels = dust.dimvalue(0)
dust[dust<5] = 0
height = meteolib.pressure_to_height_std(levels)
lat = dust.dimvalue(1)
lon = dust.dimvalue(2)

#Plot
cn_layer = shaperead('cn_province')
world_layer = shaperead('country')
ax = axes3dgl(bbox=True)
ax.plot_layer(cn_layer)
ax.plot_layer(world_layer, edgecolor='b')
#ax.set_lighting(True, position=[1,1,1,1], mat_specular=[0.5,0.5,0.5,1])
levs = [50,100,200,300,400,500]
cmap='WhiteBlueGreenYellowRed'
#cmap = 'MPL_Oranges'
pp = ax.plot_particles(lon, lat, height, dust, levs, vmin=20, s=2, \
    cmap=cmap, alpha_min=0.4, alpha_max=0.7, density=3)
colorbar(pp)
xlim(65, 155)
xlabel('Longitude')
ylim(15, 65)
ylabel('Latitude')
zlim(0, 15000)
zlabel('Height (m)')
#zticks(arange(len(levels))[1:], levels[1:])
tt = st + datetime.timedelta(hours=t*3)
title('Dust concentration ug/m3 (%s)' % tt.strftime('%Y-%m-%d %H:00'))
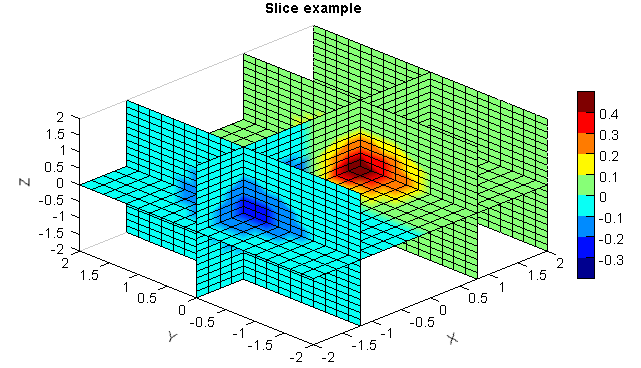
3D slice plot:
X=Y=Z = arange(-2, 2.1, 0.2)
X,Y,Z = meshgrid(X, Y, Z)
V = X*exp(-X**2-Y**2-Z**2)

xslice = [-1.2,0.8,2]
yslice = [0]
zslice = 0
ax = axes3dgl()
gs = ax.plot_slice(X,Y,Z,V,xslice=xslice,yslice=yslice,zslice=zslice)
colorbar(gs[0])
title('Slice example')