MeteoInfo 3.5 was released (2022-12-26)
Add LineRender and PipeRender to plot 3D lines with VBO
Add QuiverRender to plot 3D quivers with VBO
Add imageio-jpeg 3.9.4 to support JPEG file with CMYK color profile
Add get_dbz function in wrf package
Add real and imag attributes in NDArray
Add conj and conjugate functions
Add material function for lighting setting
Add deg2rad and rad2deg functions
Add prod and cumprod functions
update isosurface function for smooth normal calculation and color array supported
Support multiple GL plots in a figure
Support China radar standard base data format
Support read_dataframe function for MICAPS 3 dataset
Support trajectory frequency data file for HYSPLITConcDataInfo readDataInfo function
Support MICAPS data files for addfile function
Support calibration table data in AWX data format
Update ejml to version 0.41.1
Update FlatLaf to version 3.0
Update commons-math to version 4.0-beta1
Update commons-number to version 1.1
Update commons-rng to version 1.5
Update commons-statistics to version 1.0
Update rsyntaxtextarea to version 3.3.1
Update proj4j to version 1.2.2
Update ojAlgo to version 51.4.1
Update jython to version 2.7.3
Bugfix for TextRender memory leak
Some other bugs fixed
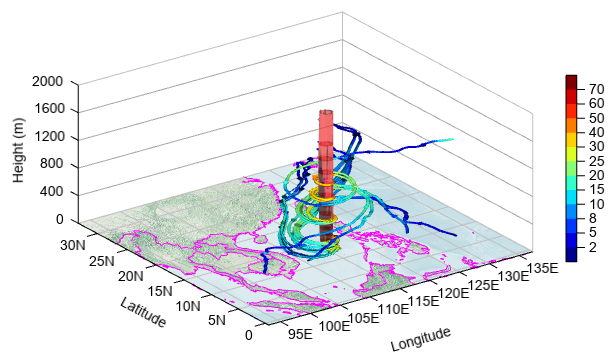
Plot 3-D stream lines around typhoon center:
clear()
print('Read data...')
fn = r'D:\Temp\LaSW\airship\T_raps\wrfout_d01_2020-10-26_18_00_00'
f = addfile(fn)
tidx = 0
tt = f.gettime(tidx)
ss = 5
u = f['U'][tidx]
v = f['V'][tidx]
w = f['W'][tidx]
u = meteo.wrf.destagger(u, -1)
v = meteo.wrf.destagger(v, -2)
w = meteo.wrf.destagger(w, -3)
w = w * 2
speed = sqrt(u*u + v*v + w*w)
nz, ny, nx = u.shape
y = u.dimvalue(1)
x = u.dimvalue(2)
height1 = meteolib.wrf.get_height(f, tidx)
height = height1[:,0,0]
speed = sqrt(u*u + v*v + w*w)
x1, y1, _ = meshgrid(x, y, arange(nz))

sz, sy, sx = where(speed[:10]>25)

print('Plot...')
axes3d(projection=f.proj)
lighting()
geoshow('eo_base.jpg', lighting=False)
geoshow('country', edgecolor='m', lighting=False)
isosurface(x, y, height, speed, 50, facecolor=[255,51,51], \
    edgecolor=None, alpha=0.7, nthread=4)
idx = speed[0].argmax()
idx = unravel_index(idx, speed[0].shape)
xx = x[idx[1]-1:idx[1]+2]
yy = y[idx[0]-1:idx[0]+2]
zz = [100, 200, 500, 800, 1000]
xx, yy, zz = meshgrid(xx, yy, zz)
xstart = xx
ystart = yy
zstart = zz
levs = [2,5,8,10,15,20,25,30,40,50,60,70]
qq = streamplot3(x, y, height, u, v, w, speed, levs=levs, density=2, linewidth=2,
    interval=100, nloop=1000, start_x=xstart, start_y=ystart,
    start_z=zstart, pipe=True, radius=0.01, lighting=True, cmap='matlab_jet')
colorbar(aspect=30)
xlim(x[0], x[-1])
ylim(y[0], y[-1])
zlim(0, 2000)
xlabel('Longitude')
ylabel('Latitude')
zlabel('Height (m)')
antialias()
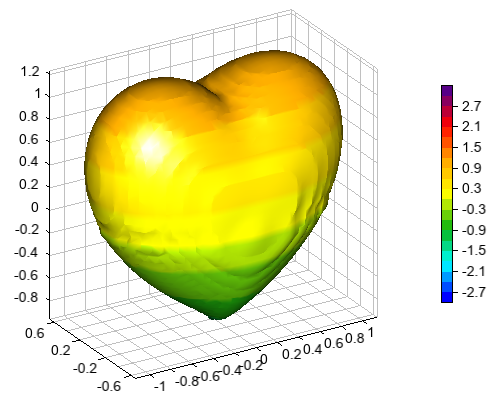
isosurface with color data array:
a = linspace(-3, 3, 100)
x,y,z = meshgrid(a, a, a)
p = (x**2+(9/4.)*y**2+z**2-1)**3-x**2*z**3-(9/80.)*y**2*z**3
axes3d(aspect='equal', axes_zoom=True)
lighting(mat_specular=1)
isosurface(x, y, z, p, 0, z, 20, cdata=z, cmap='BlAqGrYeOrReVi200')
colorbar(xshift=50)